
- Start >
- Rivers >
- Discharge >
- Iller - Lech - Bodensee >
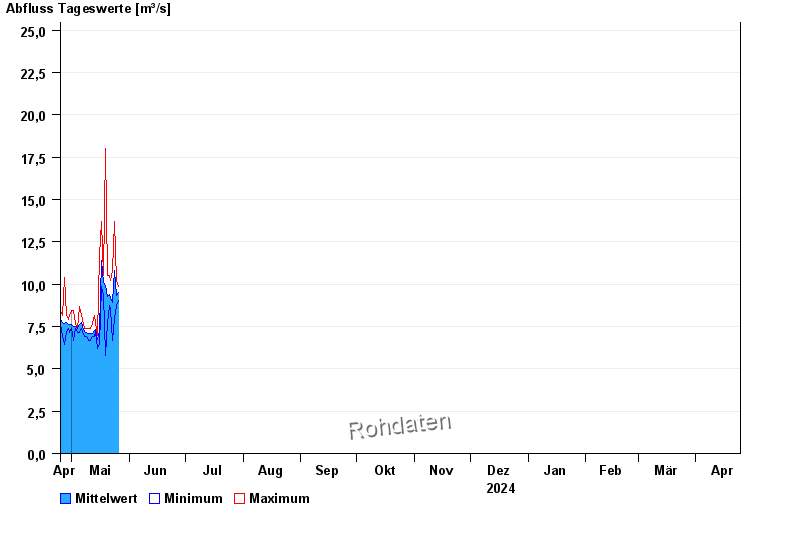
- Bächingen >
- Chart of year

Chart of year Bächingen / Brenz
Discharge from 25.04.2024 to 24.04.2025
- 25.03.1988 Abfluss: 39,2 m³/s
- 15.02.1990 Abfluss: 36,4 m³/s
- 13.04.1994 Abfluss: 35,1 m³/s
- 02.07.1987 Abfluss: 33,4 m³/s
- 22.03.2002 Abfluss: 32,9 m³/s
| Date | Mean value [m³/s] | Maximum [m³/s] | Minimum [m³/s] |
|---|---|---|---|
| 06.05.2024 | 8.12 | 8.17 | 7.91 |
| 05.05.2024 | 7.62 | 8.7 | 7.15 |
| 04.05.2024 | 7.37 | 7.4 | 7.15 |
| 03.05.2024 | 7.53 | 7.65 | 7.4 |
| 02.05.2024 | 7.5 | 8.43 | 6.67 |
| 01.05.2024 | 7.59 | 8.43 | 7.4 |
| 30.04.2024 | 7.59 | 8.17 | 7.15 |
© Bayerisches Landesamt für Umwelt 2024