
- Start >
- Rivers >
- Discharge >
- Iller - Lech - Bodensee >
- Aeschach >
- Chart of year

Chart of year Aeschach / Oberreitnauer Ach
Discharge from 01.01.2018 to 31.12.2018
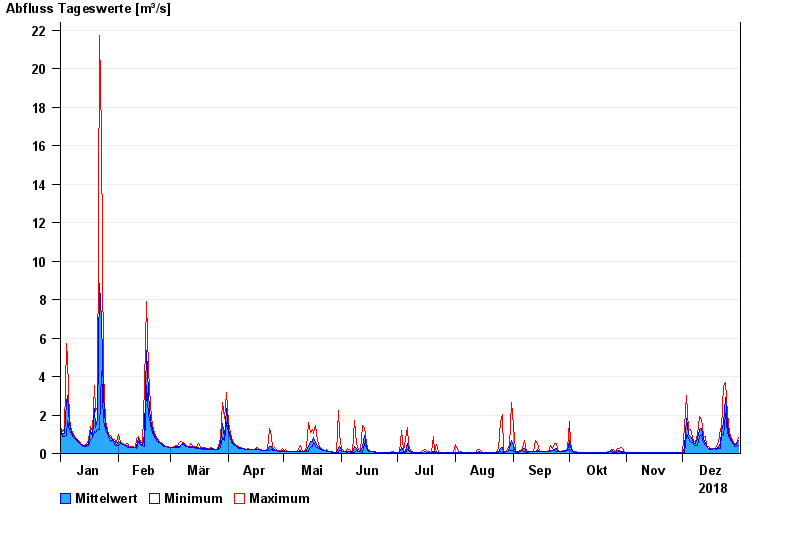
| Date | Mean value [m³/s] | Maximum [m³/s] | Minimum [m³/s] |
|---|---|---|---|
| 31.12.2018 | 0.669 | 0.826 | 0.422 |
| 30.12.2018 | 0.45 | 0.525 | 0.35 |
| 29.12.2018 | 0.418 | 0.471 | 0.35 |
| 28.12.2018 | 0.536 | 0.608 | 0.471 |
| 27.12.2018 | 0.674 | 0.76 | 0.608 |
| 26.12.2018 | 0.898 | 1.07 | 0.76 |
| 25.12.2018 | 1.48 | 2.09 | 1.07 |
© Bayerisches Landesamt für Umwelt 2024