
- Start >
- Rivers >
- Discharge >
- Iller - Lech - Bodensee >
- Aeschach >
- Chart of year

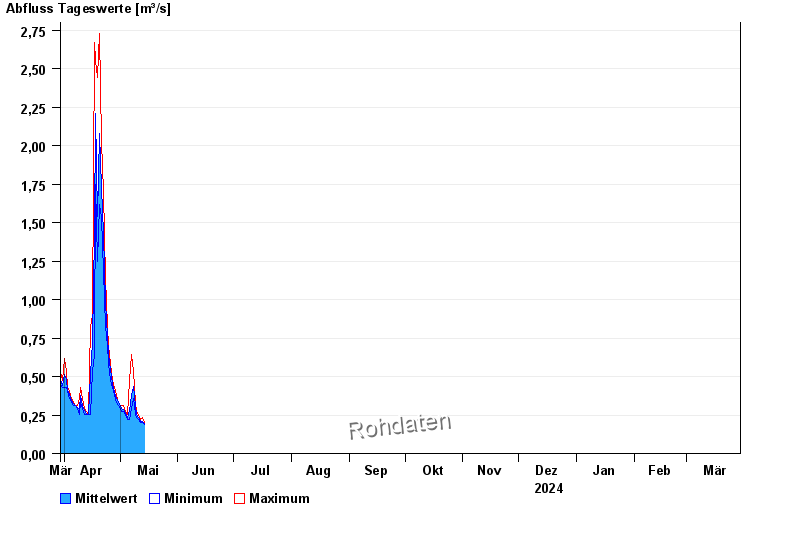
Chart of year Aeschach / Oberreitnauer Ach
Discharge from 30.03.2024 to 29.03.2025
| Date | Mean value [m³/s] | Maximum [m³/s] | Minimum [m³/s] |
|---|---|---|---|
| 31.05.2024 | 5.52 | 13.2 | 3.19 |
| 30.05.2024 | 2.12 | 3.63 | 0.614 |
| 29.05.2024 | 0.622 | 0.733 | 0.557 |
| 28.05.2024 | 1.02 | 1.29 | 0.703 |
| 27.05.2024 | 0.45 | 0.643 | 0.402 |
| 26.05.2024 | 0.529 | 0.643 | 0.427 |
| 25.05.2024 | 0.689 | 0.827 | 0.585 |
© Bayerisches Landesamt für Umwelt 2024