
- Start >
- Rivers >
- Discharge >
- Iller - Lech - Bodensee >
- Aeschach >
- Chart of year

Chart of year Aeschach / Oberreitnauer Ach
Discharge from 28.04.2024 to 27.04.2025
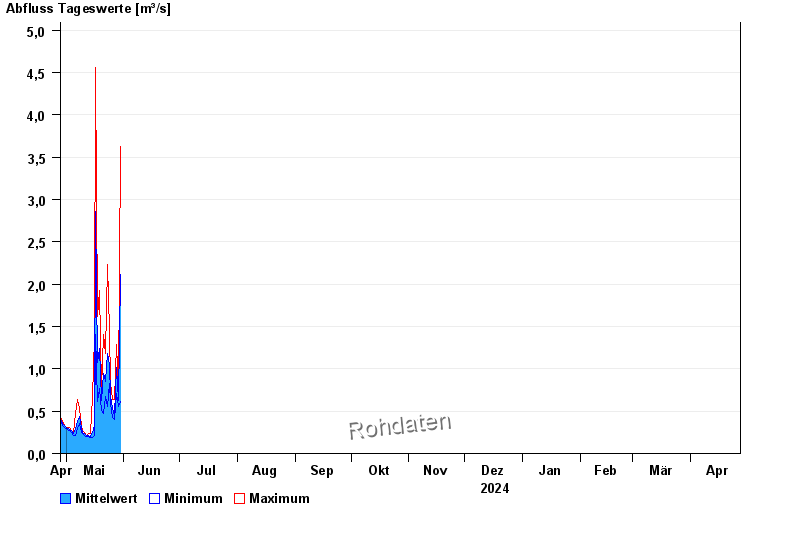
| Date | Mean value [m³/s] | Maximum [m³/s] | Minimum [m³/s] |
|---|---|---|---|
| 02.06.2024 | 8.18 | 13.9 | 4.92 |
| 01.06.2024 | -- | -- | -- |
| 31.05.2024 | -- | -- | -- |
| 30.05.2024 | 2.12 | 3.63 | 0.614 |
| 29.05.2024 | 0.622 | 0.733 | 0.557 |
| 28.05.2024 | 1.02 | 1.29 | 0.703 |
| 27.05.2024 | 0.45 | 0.643 | 0.402 |
© Bayerisches Landesamt für Umwelt 2024