
- Start >
- Rivers >
- Discharge >
- Iller - Lech - Bodensee >
- Aeschach >
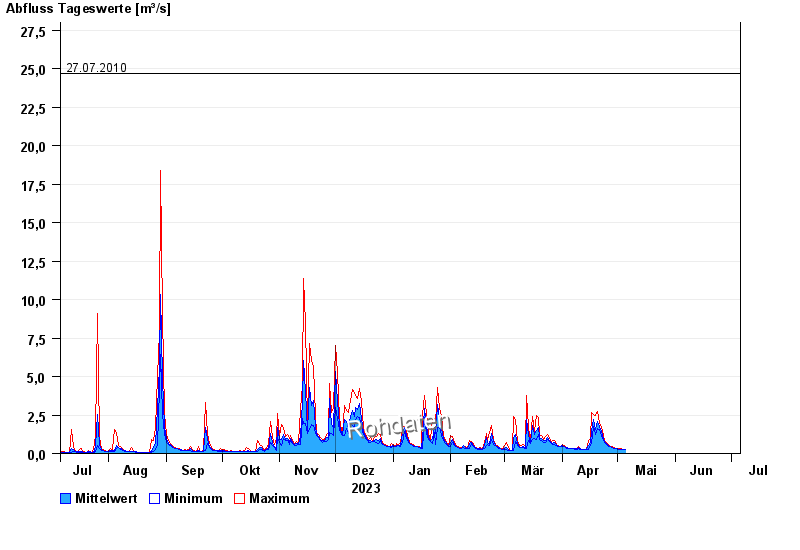
- Chart of year

Chart of year Aeschach / Oberreitnauer Ach
Discharge from 06.07.2023 to 05.07.2024
- 18.06.2010 Abfluss: 39,3 m³/s
- 11.08.2002 Abfluss: 35,7 m³/s
- 17.06.1991 Abfluss: 29,2 m³/s
- 09.08.2007 Abfluss: 27,7 m³/s
- 27.07.2010 Abfluss: 24,7 m³/s
| Date | Mean value [m³/s] | Maximum [m³/s] | Minimum [m³/s] |
|---|---|---|---|
| 16.06.2024 | 0.521 | 0.585 | 0.477 |
| 15.06.2024 | 0.643 | 0.827 | 0.503 |
| 14.06.2024 | 0.572 | 0.614 | 0.53 |
| 13.06.2024 | 0.693 | 0.763 | 0.585 |
| 12.06.2024 | 0.899 | 1.07 | 0.733 |
| 11.06.2024 | 1.33 | 1.7 | 1.07 |
| 10.06.2024 | 3.05 | 4.74 | 1.7 |
© Bayerisches Landesamt für Umwelt 2024