
- Start >
- Rivers >
- Discharge >
- Iller - Lech - Bodensee >
- Aeschach >
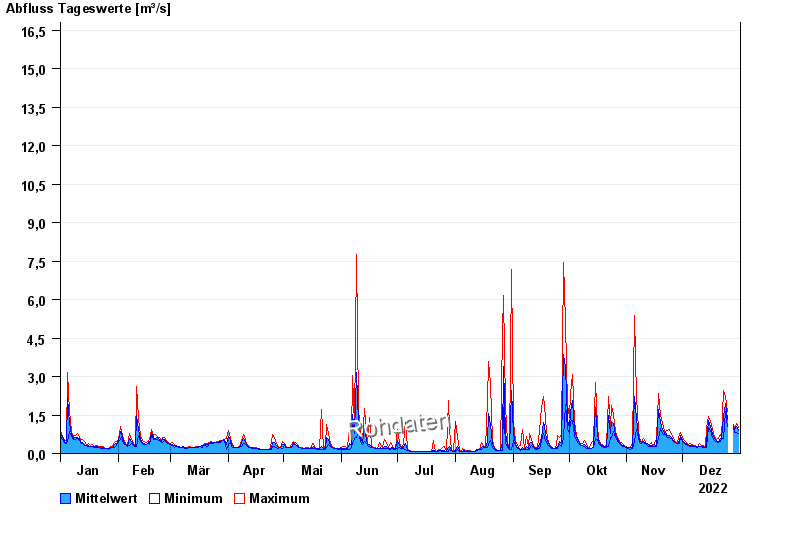
- Chart of year

Chart of year Aeschach / Oberreitnauer Ach
Discharge from 01.01.2022 to 31.12.2022
 Für diesen Pegel sind keine Jährlichkeiten hinterlegt.
| Date | Mean value [m³/s] | Maximum [m³/s] | Minimum [m³/s] |
|---|---|---|---|
| 31.12.2022 | 0.899 | 1 | 0.797 |
| 30.12.2022 | 1.07 | 1.18 | 0.832 |
| 29.12.2022 | 0.897 | 0.964 | 0.832 |
| 28.12.2022 | 1.05 | 1.14 | 0.964 |
| 27.12.2022 | -- | -- | -- |
| 26.12.2022 | -- | -- | -- |
| 25.12.2022 | 1.31 | 1.64 | 1.04 |
© Bayerisches Landesamt für Umwelt 2024