
- Start >
- Rivers >
- Discharge >
- Iller - Lech - Bodensee >
- Achsheim >
- Chart of year

Chart of year Achsheim / Schmutter
Discharge from 01.01.2024 to 08.05.2024
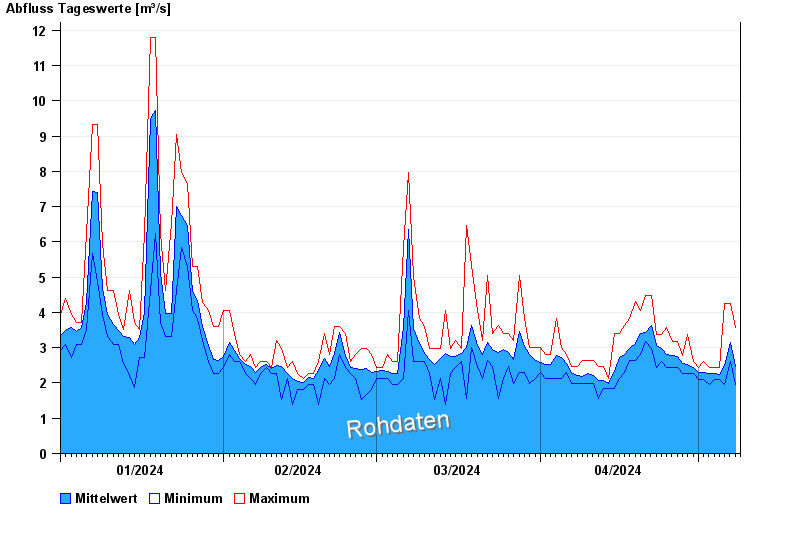
| Date | Mean value [m³/s] | Maximum [m³/s] | Minimum [m³/s] |
|---|---|---|---|
| 08.05.2024 | 2.49 | 3.58 | 2.11 |
| 07.05.2024 | 3.17 | 4.25 | 2.61 |
| 06.05.2024 | 2.5 | 4.25 | 1.95 |
| 05.05.2024 | 2.25 | 2.44 | 2.11 |
| 04.05.2024 | 2.26 | 2.44 | 2.11 |
| 03.05.2024 | 2.27 | 2.44 | 1.95 |
| 02.05.2024 | 2.31 | 2.61 | 2.11 |
© Bayerisches Landesamt für Umwelt 2024