
- Start >
- Rivers >
- Discharge >
- Oberer Main - Elbe >
- Zigeunermühle >
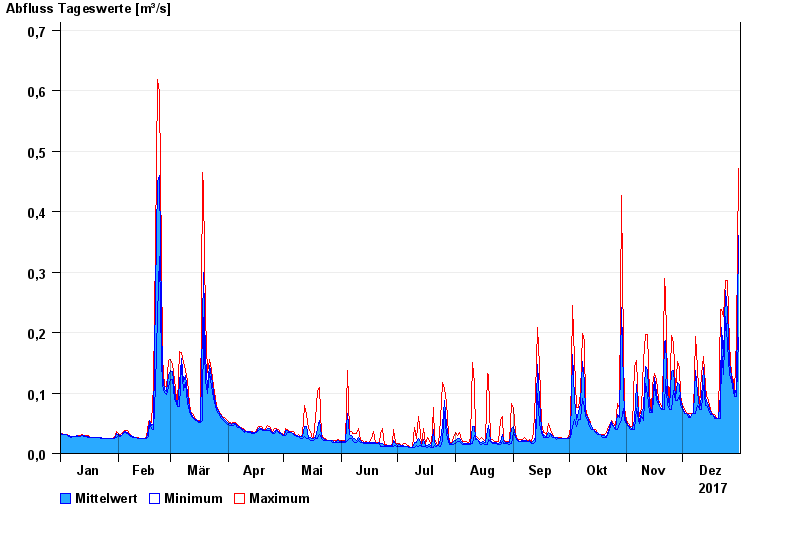
- Chart of year

Chart of year Zigeunermühle / Lehstenbach
Discharge from 01.01.2017 to 31.12.2017
 Für diesen Pegel sind keine Hauptwerte hinterlegt.
| Date | Mean value [m³/s] | Maximum [m³/s] | Minimum [m³/s] |
|---|---|---|---|
| 31.12.2017 | 0.36 | 0.472 | 0.192 |
| 30.12.2017 | 0.107 | 0.192 | 0.094 |
| 29.12.2017 | 0.097 | 0.102 | 0.094 |
| 28.12.2017 | 0.113 | 0.12 | 0.102 |
| 27.12.2017 | 0.127 | 0.13 | 0.12 |
| 26.12.2017 | 0.15 | 0.181 | 0.13 |
| 25.12.2017 | 0.235 | 0.286 | 0.181 |
© Bayerisches Landesamt für Umwelt 2024