
- Start >
- Rivers >
- Discharge >
- Oberer Main - Elbe >
- Zigeunermühle >
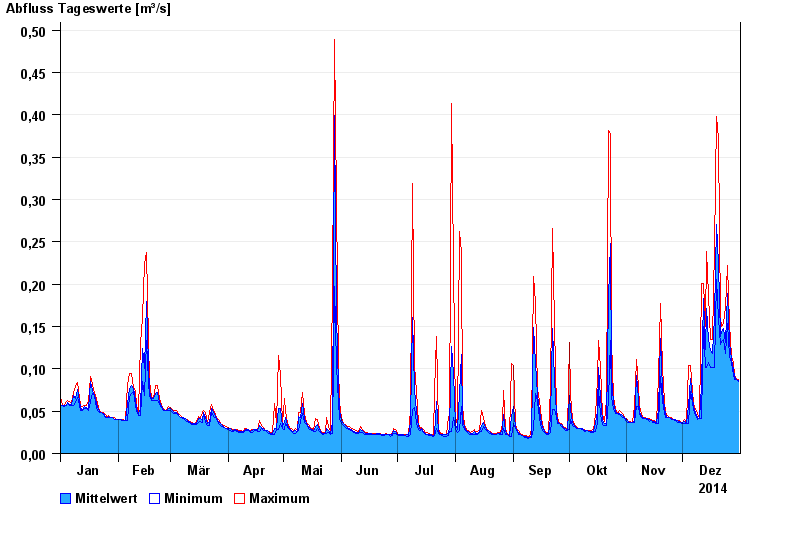
- Chart of year

Chart of year Zigeunermühle / Lehstenbach
Discharge from 01.01.2014 to 31.12.2014
 Für diesen Pegel sind keine Hauptwerte hinterlegt.
| Date | Mean value [m³/s] | Maximum [m³/s] | Minimum [m³/s] |
|---|---|---|---|
| 31.12.2014 | 0.086 | 0.087 | 0.085 |
| 30.12.2014 | 0.087 | 0.087 | 0.087 |
| 29.12.2014 | 0.091 | 0.092 | 0.087 |
| 28.12.2014 | 0.099 | 0.107 | 0.092 |
| 27.12.2014 | 0.111 | 0.115 | 0.107 |
| 26.12.2014 | 0.131 | 0.153 | 0.115 |
| 25.12.2014 | 0.189 | 0.222 | 0.153 |
© Bayerisches Landesamt für Umwelt 2024