
- Start >
- Rivers >
- Discharge >
- Oberer Main - Elbe >
- Zigeunermühle >
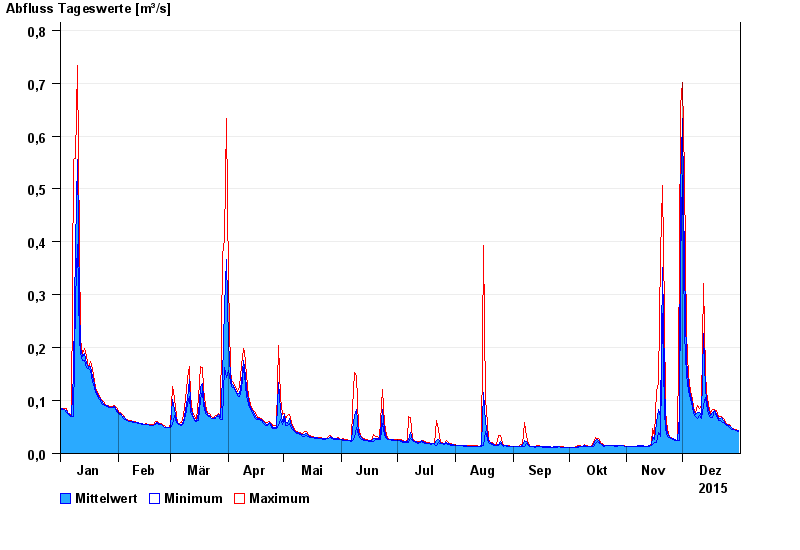
- Chart of year

Chart of year Zigeunermühle / Lehstenbach
Discharge from 01.01.2015 to 31.12.2015
 Für diesen Pegel sind keine Hauptwerte hinterlegt.
| Date | Mean value [m³/s] | Maximum [m³/s] | Minimum [m³/s] |
|---|---|---|---|
| 31.12.2015 | 0.043 | 0.043 | 0.042 |
| 30.12.2015 | 0.044 | 0.045 | 0.043 |
| 29.12.2015 | 0.045 | 0.045 | 0.045 |
| 28.12.2015 | 0.046 | 0.048 | 0.045 |
| 27.12.2015 | 0.049 | 0.049 | 0.046 |
| 26.12.2015 | 0.052 | 0.055 | 0.049 |
| 25.12.2015 | 0.054 | 0.055 | 0.053 |
© Bayerisches Landesamt für Umwelt 2024