
- Start >
- Rivers >
- Discharge >
- Oberer Main - Elbe >
- Zigeunermühle >
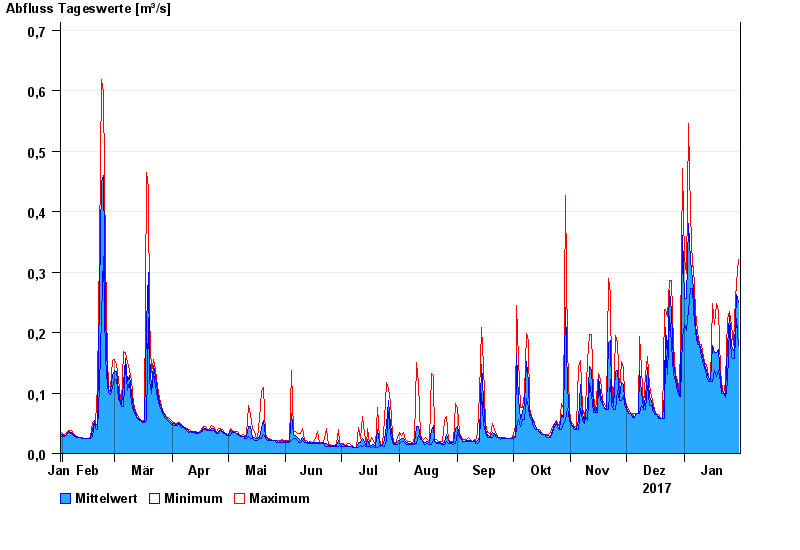
- Chart of year

Chart of year Zigeunermühle / Lehstenbach
Discharge from 31.01.2017 to 30.01.2018
 Für diesen Pegel sind keine -Winter hinterlegt.
| Date | Mean value [m³/s] | Maximum [m³/s] | Minimum [m³/s] |
|---|---|---|---|
| 30.01.2018 | 0.25 | 0.32 | 0.178 |
| 29.01.2018 | 0.263 | 0.283 | 0.223 |
| 28.01.2018 | 0.175 | 0.223 | 0.157 |
| 27.01.2018 | 0.171 | 0.179 | 0.157 |
| 26.01.2018 | 0.177 | 0.212 | 0.158 |
| 25.01.2018 | 0.229 | 0.235 | 0.212 |
| 24.01.2018 | 0.179 | 0.224 | 0.118 |
© Bayerisches Landesamt für Umwelt 2024