
- Start >
- Rivers >
- Discharge >
- Oberer Main - Elbe >
- Windischeschenbach >
- Chart of total period

Chart of total period Windischeschenbach / Waldnaab
Discharge from 01.11.1956 to 01.05.2024
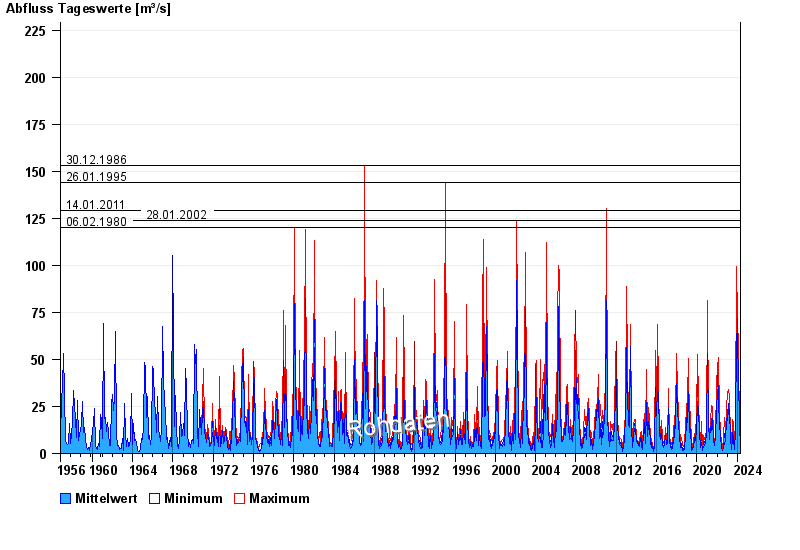
- 30.12.1986 Abfluss: 153 m³/s
- 26.01.1995 Abfluss: 144 m³/s
- 14.01.2011 Abfluss: 129 m³/s
- 28.01.2002 Abfluss: 124 m³/s
- 06.02.1980 Abfluss: 120 m³/s
| Date | Mean value [m³/s] | Maximum [m³/s] | Minimum [m³/s] |
|---|---|---|---|
| 01.05.2024 | 5.8 | 6.2 | 5.22 |
| 30.04.2024 | 6.04 | 6.46 | 5.7 |
| 29.04.2024 | 6.64 | 6.99 | 6.2 |
| 28.04.2024 | 7.47 | 8.1 | 6.46 |
| 27.04.2024 | 8.48 | 9.27 | 8.1 |
| 26.04.2024 | 9.84 | 10.8 | 9.27 |
| 25.04.2024 | 9.78 | 10.5 | 8.68 |
© Bayerisches Landesamt für Umwelt 2024