
- Start >
- Rivers >
- Discharge >
- Oberer Main - Elbe >
- Weismain >
- Chart of year

Chart of year Weismain / Weismain
Discharge from 01.01.2024 to 27.04.2024
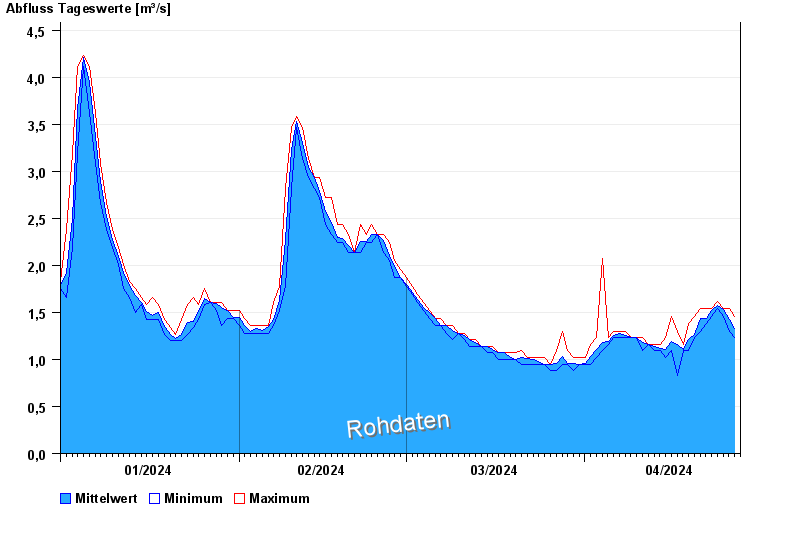
| Date | Mean value [m³/s] | Maximum [m³/s] | Minimum [m³/s] |
|---|---|---|---|
| 27.04.2024 | 1.36 | 1.46 | 1.3 |
| 26.04.2024 | 1.42 | 1.54 | 1.3 |
| 25.04.2024 | 1.53 | 1.54 | 1.46 |
| 24.04.2024 | 1.57 | 1.62 | 1.54 |
| 23.04.2024 | 1.52 | 1.54 | 1.46 |
| 22.04.2024 | 1.44 | 1.54 | 1.38 |
| 21.04.2024 | 1.44 | 1.54 | 1.3 |
© Bayerisches Landesamt für Umwelt 2024