
- Start >
- Rivers >
- Discharge >
- Oberer Main - Elbe >
- Wasserburg >
- Chart of year

Chart of year Wasserburg / Inn
Discharge from 06.03.2023 to 05.03.2024
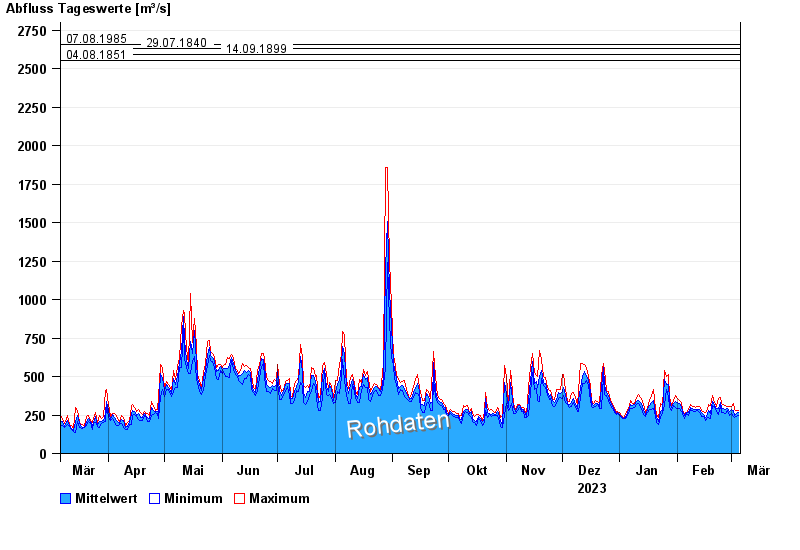
- 23.08.2005 Abfluss: 2940 m³/s
- 07.08.1985 Abfluss: 2660 m³/s
- 29.07.1840 Abfluss: 2630 m³/s
- 14.09.1899 Abfluss: 2590 m³/s
- 04.08.1851 Abfluss: 2550 m³/s
| Date | Mean value [m³/s] | Maximum [m³/s] | Minimum [m³/s] |
|---|---|---|---|
| 05.03.2024 | 269 | 282 | 246 |
| 04.03.2024 | 262 | 278 | 242 |
| 03.03.2024 | 249 | 289 | 232 |
| 02.03.2024 | 278 | 328 | 240 |
| 01.03.2024 | 283 | 303 | 263 |
| 29.02.2024 | 274 | 308 | 244 |
| 28.02.2024 | 290 | 308 | 282 |
© Bayerisches Landesamt für Umwelt 2024