
- Start >
- Rivers >
- Discharge >
- Oberer Main - Elbe >
- Unterzettlitz >
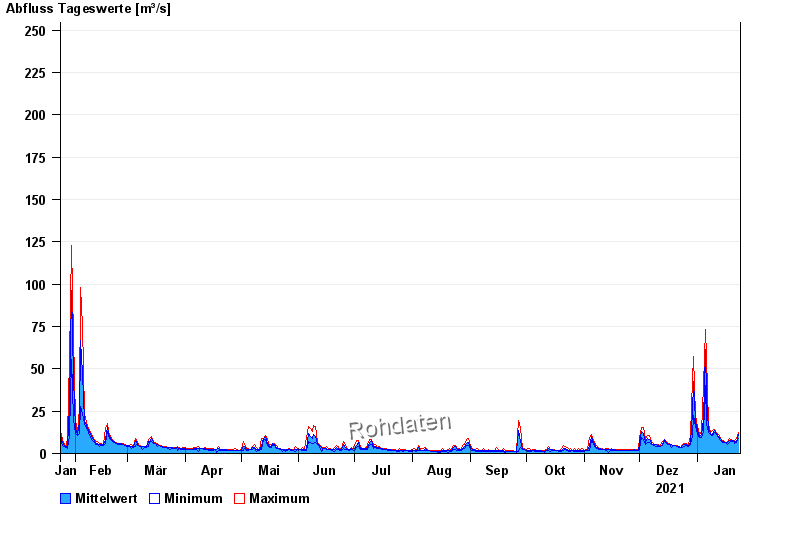
- Chart of year

Chart of year Unterzettlitz / Roter Main
Discharge from 24.01.2021 to 23.01.2022
 Für diesen Pegel sind keine Jährlichkeiten hinterlegt.
| Date | Mean value [m³/s] | Maximum [m³/s] | Minimum [m³/s] |
|---|---|---|---|
| 23.01.2022 | 11.3 | 12.4 | 8.88 |
| 22.01.2022 | 7.18 | 8.7 | 6.41 |
| 21.01.2022 | 6.96 | 7.59 | 5.96 |
| 20.01.2022 | 7.45 | 7.87 | 7.23 |
| 19.01.2022 | 7.79 | 8.33 | 6.86 |
| 18.01.2022 | 7.93 | 8.6 | 6.32 |
| 17.01.2022 | 6.24 | 6.5 | 5.16 |
© Bayerisches Landesamt für Umwelt 2024