
- Start >
- Rivers >
- Discharge >
- Oberer Main - Elbe >
- Unterzettlitz >
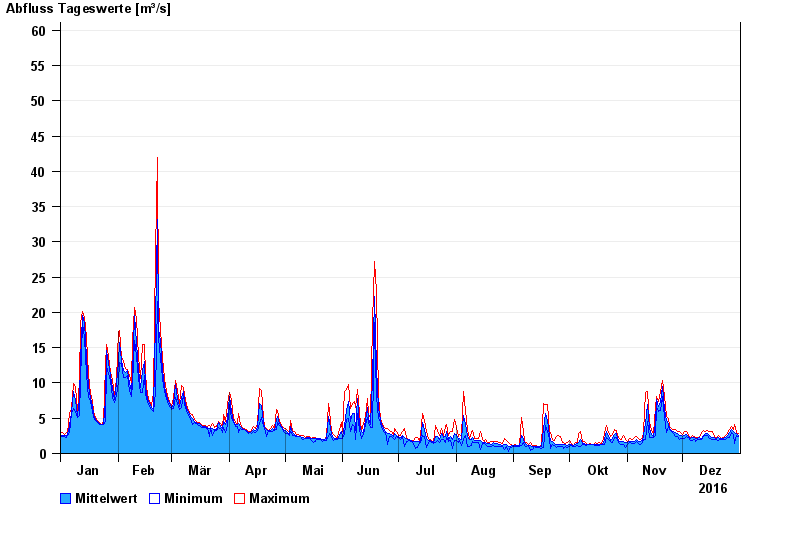
- Chart of year

Chart of year Unterzettlitz / Roter Main
Discharge from 01.01.2016 to 31.12.2016
- 26.01.1995 Abfluss: 191 m³/s
- 21.12.1993 Abfluss: 142 m³/s
- 24.12.1967 Abfluss: 130 m³/s
- 03.01.2003 Abfluss: 122 m³/s
- 15.01.1968 Abfluss: 122 m³/s
| Date | Mean value [m³/s] | Maximum [m³/s] | Minimum [m³/s] |
|---|---|---|---|
| 31.12.2016 | 2.58 | 2.8 | 2.36 |
| 30.12.2016 | 2.77 | 3.04 | 2.58 |
| 29.12.2016 | 3.02 | 4.12 | 1.4 |
| 28.12.2016 | 3.07 | 3.37 | 2.73 |
| 27.12.2016 | 3.42 | 3.78 | 2.97 |
| 26.12.2016 | 2.91 | 3.45 | 2.29 |
| 25.12.2016 | 2.51 | 2.81 | 2.21 |
© Bayerisches Landesamt für Umwelt 2024