
- Start >
- Rivers >
- Discharge >
- Oberer Main - Elbe >
- Unterzettlitz >
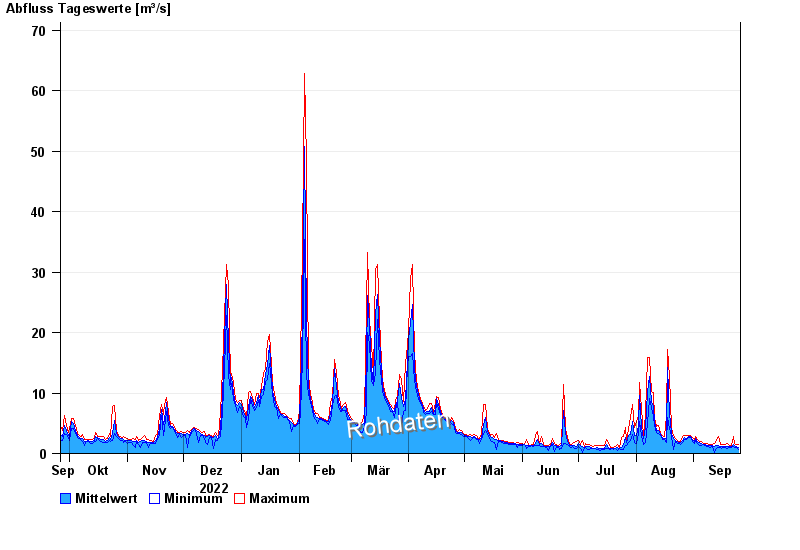
- Chart of year

Chart of year Unterzettlitz / Roter Main
Discharge from 26.09.2022 to 25.09.2023
| Date | Mean value [m³/s] | Maximum [m³/s] | Minimum [m³/s] |
|---|---|---|---|
| 25.09.2023 | 1.07 | 1.41 | 0.702 |
| 24.09.2023 | 1.2 | 1.41 | 0.989 |
| 23.09.2023 | 1.29 | 1.6 | 0.938 |
| 22.09.2023 | 1.54 | 2.81 | 1.16 |
| 21.09.2023 | 1.11 | 1.34 | 0.938 |
| 20.09.2023 | 1.19 | 1.34 | 0.938 |
| 19.09.2023 | 1.22 | 1.66 | 0.84 |
© Bayerisches Landesamt für Umwelt 2024