
- Start >
- Rivers >
- Discharge >
- Oberer Main - Elbe >
- Unterzettlitz >
- Chart of year

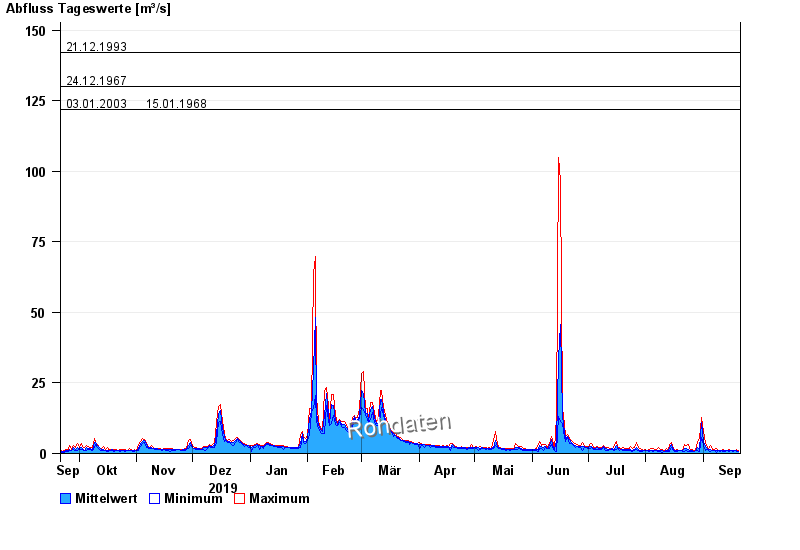
Chart of year Unterzettlitz / Roter Main
Discharge from 21.09.2019 to 20.09.2020
- 26.01.1995 Abfluss: 191 m³/s
- 21.12.1993 Abfluss: 142 m³/s
- 24.12.1967 Abfluss: 130 m³/s
- 03.01.2003 Abfluss: 122 m³/s
- 15.01.1968 Abfluss: 122 m³/s
| Date | Mean value [m³/s] | Maximum [m³/s] | Minimum [m³/s] |
|---|---|---|---|
| 20.09.2020 | 0.874 | 1.01 | 0.813 |
| 19.09.2020 | 0.929 | 1.42 | 0.555 |
| 18.09.2020 | 0.935 | 1.01 | 0.91 |
| 17.09.2020 | 0.934 | 1.01 | 0.858 |
| 16.09.2020 | 0.98 | 1.06 | 0.91 |
| 15.09.2020 | 0.972 | 1.42 | 0.594 |
| 14.09.2020 | 0.962 | 1.01 | 0.91 |
© Bayerisches Landesamt für Umwelt 2024