
- Start >
- Rivers >
- Discharge >
- Oberer Main - Elbe >
- Unterzettlitz >
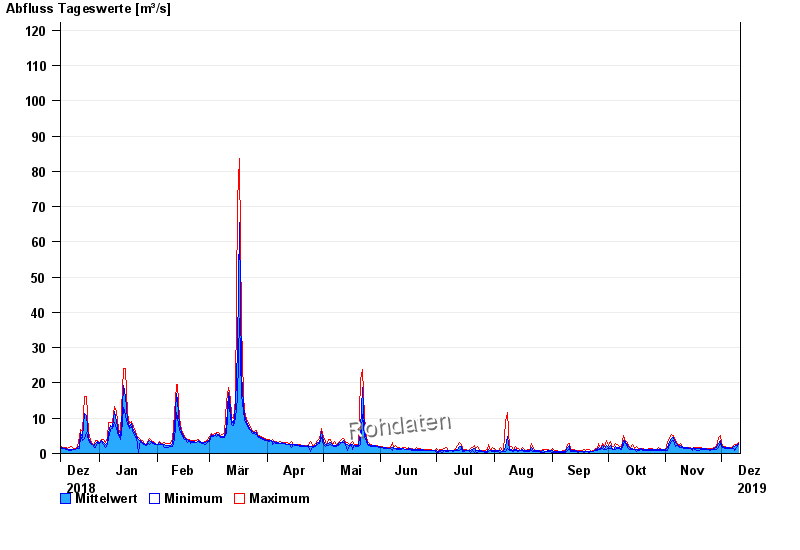
- Chart of year

Chart of year Unterzettlitz / Roter Main
Discharge from 11.12.2018 to 10.12.2019
- 26.01.1995 Abfluss: 191 m³/s
- 21.12.1993 Abfluss: 142 m³/s
- 24.12.1967 Abfluss: 130 m³/s
- 03.01.2003 Abfluss: 122 m³/s
- 15.01.1968 Abfluss: 122 m³/s
| Date | Mean value [m³/s] | Maximum [m³/s] | Minimum [m³/s] |
|---|---|---|---|
| 10.12.2019 | 2.93 | 3.14 | 2.51 |
| 09.12.2019 | 2.17 | 2.59 | 1.6 |
| 08.12.2019 | 1.98 | 2.44 | 0.891 |
| 07.12.2019 | 1.96 | 2.37 | 1.53 |
| 06.12.2019 | 1.53 | 1.6 | 1.36 |
| 05.12.2019 | 1.6 | 1.66 | 1.42 |
| 04.12.2019 | 1.63 | 1.77 | 1.47 |
© Bayerisches Landesamt für Umwelt 2024