
- Start >
- Rivers >
- Discharge >
- Oberer Main - Elbe >
- Unterzettlitz >
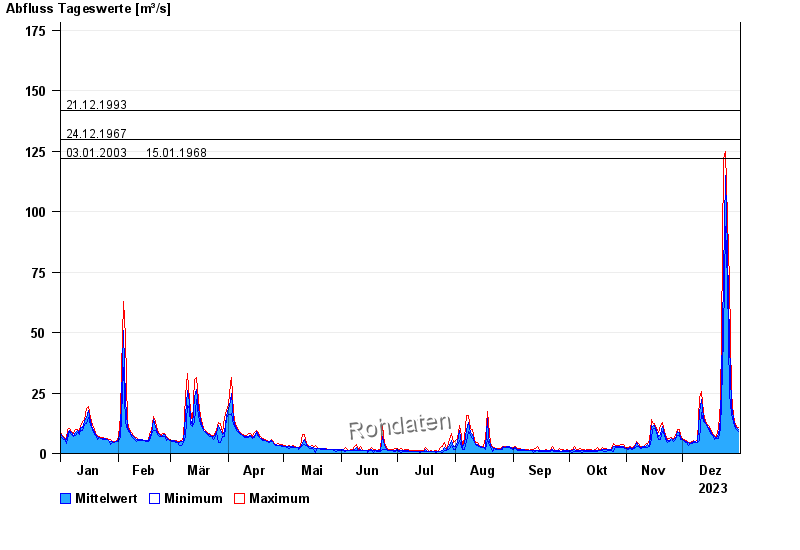
- Chart of year

Chart of year Unterzettlitz / Roter Main
Discharge from 01.01.2023 to 31.12.2023
- 26.01.1995 Abfluss: 191 m³/s
- 21.12.1993 Abfluss: 142 m³/s
- 24.12.1967 Abfluss: 130 m³/s
- 03.01.2003 Abfluss: 122 m³/s
- 15.01.1968 Abfluss: 122 m³/s
| Date | Mean value [m³/s] | Maximum [m³/s] | Minimum [m³/s] |
|---|---|---|---|
| 31.12.2023 | 9.74 | 10.6 | 9.28 |
| 30.12.2023 | 10.7 | 11.2 | 10.1 |
| 29.12.2023 | 12.1 | 13.1 | 11.2 |
| 28.12.2023 | 14.6 | 15.9 | 13 |
| 27.12.2023 | 19.4 | 24.8 | 16 |
| 26.12.2023 | 46.5 | 71.2 | 24.8 |
| 25.12.2023 | 82.9 | 97 | 71.2 |
© Bayerisches Landesamt für Umwelt 2024