
- Start >
- Rivers >
- Discharge >
- Oberer Main - Elbe >
- Unterzettlitz >
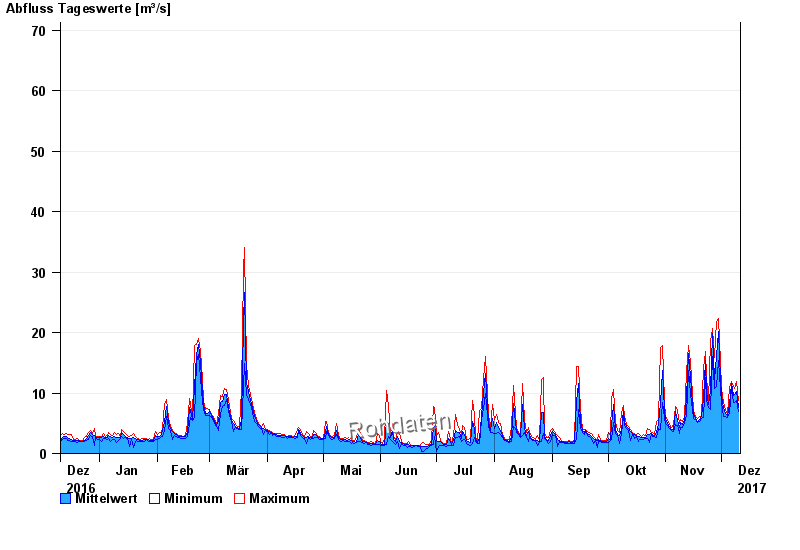
- Chart of year

Chart of year Unterzettlitz / Roter Main
Discharge from 11.12.2016 to 10.12.2017
 Für diesen Pegel sind keine Jährlichkeiten hinterlegt.
| Date | Mean value [m³/s] | Maximum [m³/s] | Minimum [m³/s] |
|---|---|---|---|
| 10.12.2017 | 7.58 | 8.81 | 6.96 |
| 09.12.2017 | 10.3 | 11.9 | 8.71 |
| 08.12.2017 | 9.76 | 10.8 | 8.42 |
| 07.12.2017 | 9.67 | 11 | 8.51 |
| 06.12.2017 | 11.5 | 11.9 | 10.9 |
| 05.12.2017 | 8.13 | 10.9 | 6.67 |
| 04.12.2017 | 6.24 | 6.67 | 6.01 |
© Bayerisches Landesamt für Umwelt 2024