
- Start >
- Rivers >
- Discharge >
- Oberer Main - Elbe >
- Untersteinach >
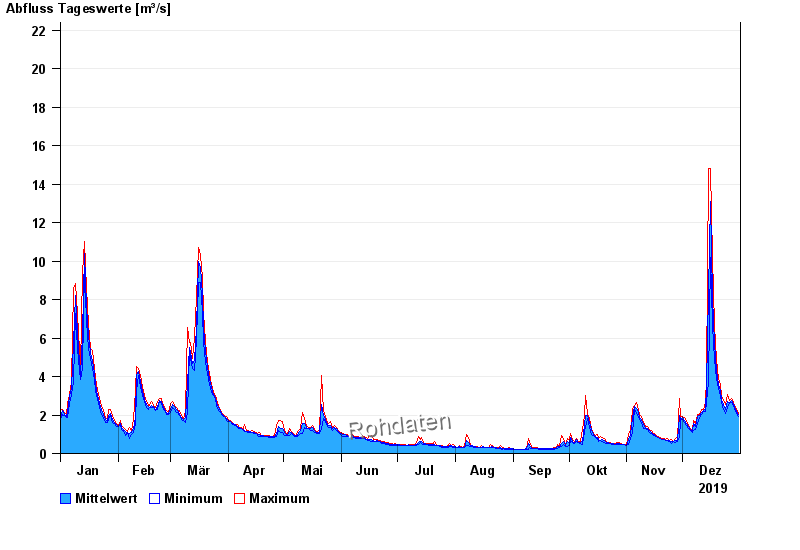
- Chart of year

Chart of year Untersteinach / Untere Steinach
Discharge from 01.01.2019 to 31.12.2019
- 10.03.1981 Abfluss: 55,8 m³/s
- 28.01.2002 Abfluss: 48,2 m³/s
- 06.01.1982 Abfluss: 47,7 m³/s
- 30.12.1986 Abfluss: 44 m³/s
- 14.01.2011 Abfluss: 41,7 m³/s
| Date | Mean value [m³/s] | Maximum [m³/s] | Minimum [m³/s] |
|---|---|---|---|
| 31.12.2019 | 2.02 | 2.1 | 1.93 |
| 30.12.2019 | 2.18 | 2.29 | 2.1 |
| 29.12.2019 | 2.37 | 2.47 | 2.29 |
| 28.12.2019 | 2.59 | 2.66 | 2.47 |
| 27.12.2019 | 2.73 | 2.86 | 2.66 |
| 26.12.2019 | 2.66 | 2.75 | 2.66 |
| 25.12.2019 | 2.71 | 3.05 | 2.37 |
© Bayerisches Landesamt für Umwelt 2024