
- Start >
- Rivers >
- Discharge >
- Oberer Main - Elbe >
- Untersteinach >
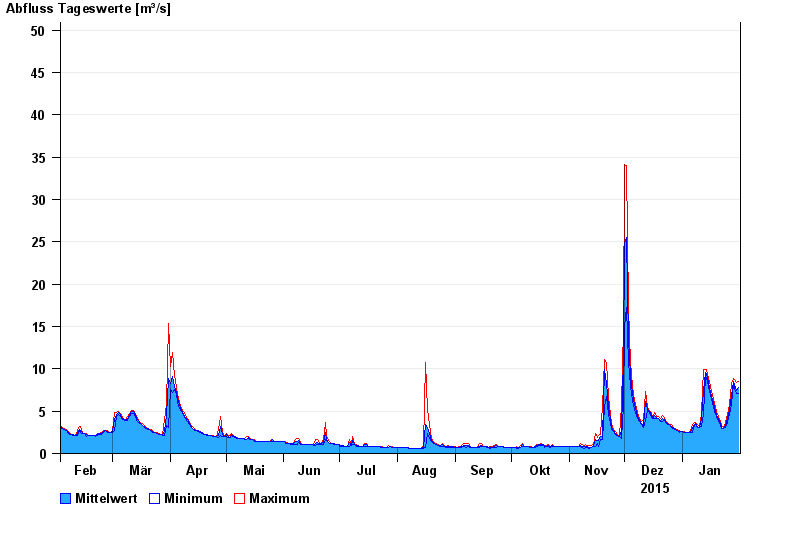
- Chart of year

Chart of year Untersteinach / Schorgast
Discharge from 01.02.2015 to 31.01.2016
note
Schlechte Netzanbindung
- 28.05.2006 Abfluss: 81,4 m³/s
- 28.01.2002 Abfluss: 76,1 m³/s
- 06.01.1982 Abfluss: 68,6 m³/s
- 27.02.2002 Abfluss: 67 m³/s
- 30.12.1986 Abfluss: 66,9 m³/s
| Date | Mean value [m³/s] | Maximum [m³/s] | Minimum [m³/s] |
|---|---|---|---|
| 31.01.2016 | 7.78 | 8.56 | 7.14 |
| 30.01.2016 | 7.42 | 8.42 | 7.14 |
| 29.01.2016 | 8.19 | 8.7 | 7.71 |
| 28.01.2016 | 8.54 | 8.84 | 8.28 |
| 27.01.2016 | 6.81 | 8.28 | 5.75 |
| 26.01.2016 | 5.17 | 5.75 | 4.59 |
| 25.01.2016 | 4.08 | 4.59 | 3.62 |
© Bayerisches Landesamt für Umwelt 2024