
- Start >
- Rivers >
- Discharge >
- Oberer Main - Elbe >
- Unterleinleiter >
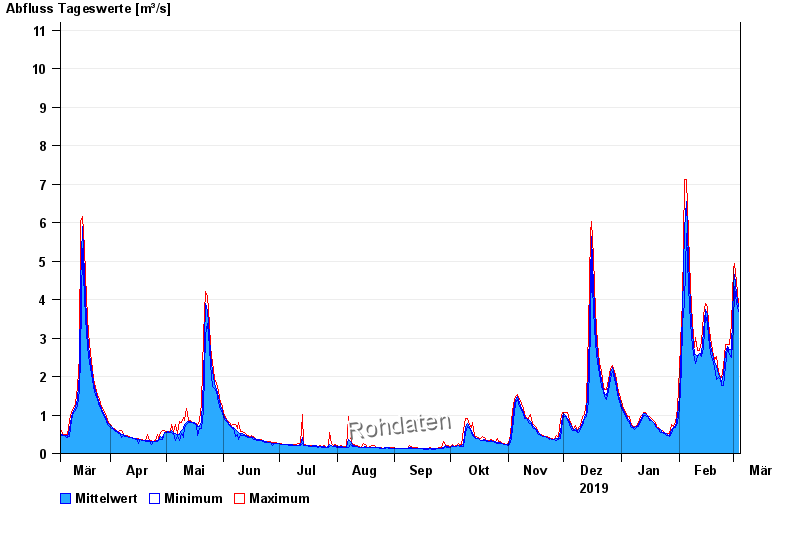
- Chart of year

Chart of year Unterleinleiter / Leinleiterbach
Discharge from 05.03.2019 to 04.03.2020
- 23.02.1970 Abfluss: 31 m³/s
- 26.01.1995 Abfluss: 30,7 m³/s
- 06.01.1982 Abfluss: 23,5 m³/s
- 26.03.1988 Abfluss: 21 m³/s
- 14.01.2011 Abfluss: 19,1 m³/s
| Date | Mean value [m³/s] | Maximum [m³/s] | Minimum [m³/s] |
|---|---|---|---|
| 04.03.2020 | 3.81 | 3.89 | 3.68 |
| 03.03.2020 | 4.17 | 4.46 | 3.89 |
| 02.03.2020 | 4.66 | 4.94 | 4.34 |
| 01.03.2020 | 4.37 | 4.82 | 3.28 |
| 29.02.2020 | 2.7 | 3.38 | 2.5 |
| 28.02.2020 | 2.69 | 2.83 | 2.58 |
| 27.02.2020 | 2.77 | 2.83 | 2.75 |
© Bayerisches Landesamt für Umwelt 2024