
- Start >
- Rivers >
- Discharge >
- Oberer Main - Elbe >
- Unterleinleiter >
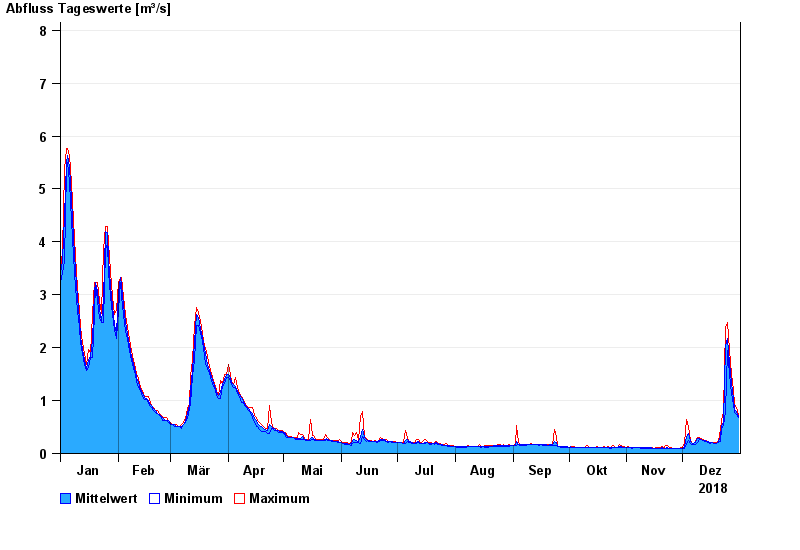
- Chart of year

Chart of year Unterleinleiter / Leinleiterbach
Discharge from 01.01.2018 to 31.12.2018
- 23.02.1970 Abfluss: 31 m³/s
- 26.01.1995 Abfluss: 30,7 m³/s
- 06.01.1982 Abfluss: 23,5 m³/s
- 26.03.1988 Abfluss: 21 m³/s
- 14.01.2011 Abfluss: 19,1 m³/s
| Date | Mean value [m³/s] | Maximum [m³/s] | Minimum [m³/s] |
|---|---|---|---|
| 31.12.2018 | 0.694 | 0.731 | 0.685 |
| 30.12.2018 | 0.798 | 0.871 | 0.729 |
| 29.12.2018 | 0.829 | 0.918 | 0.772 |
| 28.12.2018 | 1.02 | 1.19 | 0.917 |
| 27.12.2018 | 1.32 | 1.49 | 1.13 |
| 26.12.2018 | 1.71 | 1.95 | 1.49 |
| 25.12.2018 | 2.18 | 2.47 | 1.95 |
© Bayerisches Landesamt für Umwelt 2024