
- Start >
- Rivers >
- Discharge >
- Oberer Main - Elbe >
- Unterleinleiter >
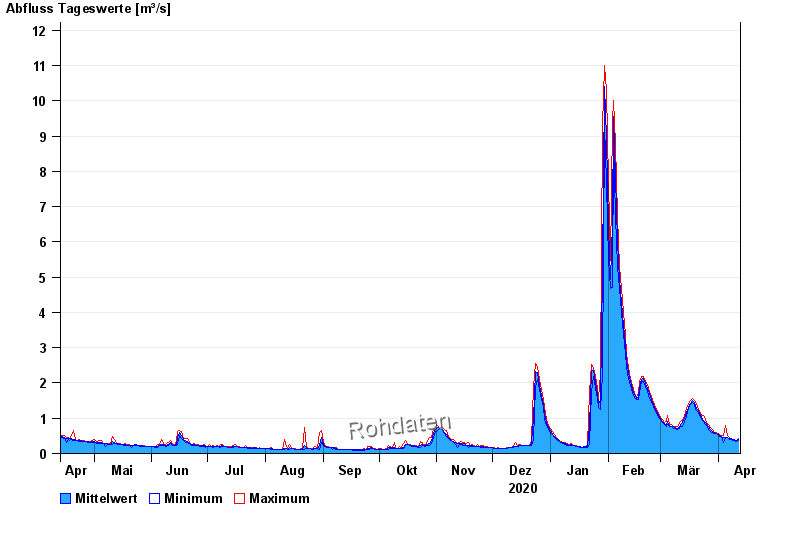
- Chart of year

Chart of year Unterleinleiter / Leinleiterbach
Discharge from 13.04.2020 to 12.04.2021
| Date | Mean value [m³/s] | Maximum [m³/s] | Minimum [m³/s] |
|---|---|---|---|
| 12.04.2021 | 0.403 | 0.439 | 0.373 |
| 11.04.2021 | 0.373 | 0.375 | 0.347 |
| 10.04.2021 | 0.386 | 0.405 | 0.375 |
| 09.04.2021 | 0.397 | 0.406 | 0.376 |
| 08.04.2021 | 0.415 | 0.438 | 0.406 |
| 07.04.2021 | 0.431 | 0.44 | 0.408 |
| 06.04.2021 | 0.458 | 0.507 | 0.44 |
© Bayerisches Landesamt für Umwelt 2024