
- Start >
- Rivers >
- Discharge >
- Oberer Main - Elbe >
- Unterleinleiter >
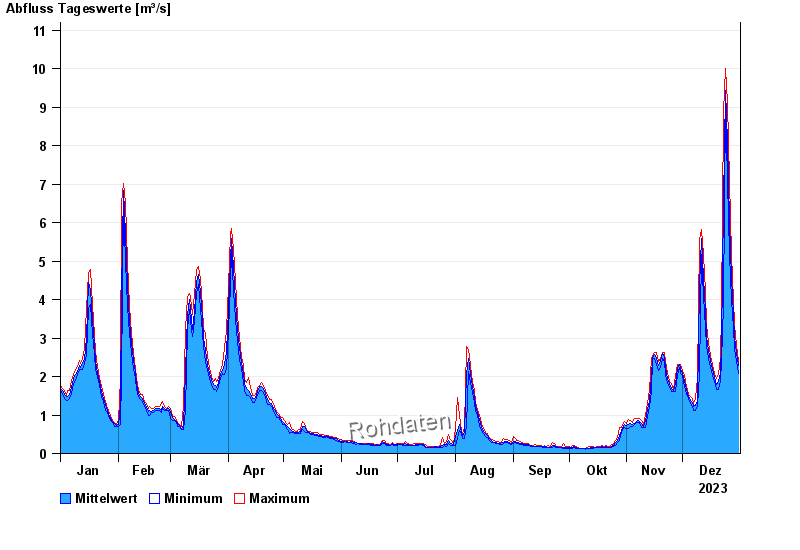
- Chart of year

Chart of year Unterleinleiter / Leinleiterbach
Discharge from 01.01.2023 to 31.12.2023
| Date | Mean value [m³/s] | Maximum [m³/s] | Minimum [m³/s] |
|---|---|---|---|
| 31.12.2023 | 2.29 | 2.39 | 2.09 |
| 30.12.2023 | 2.61 | 2.8 | 2.39 |
| 29.12.2023 | 3.02 | 3.35 | 2.72 |
| 28.12.2023 | 3.61 | 3.98 | 3.25 |
| 27.12.2023 | 4.54 | 5.16 | 3.98 |
| 26.12.2023 | 6.03 | 7.1 | 5.16 |
| 25.12.2023 | 8.12 | 9.11 | 7.1 |
© Bayerisches Landesamt für Umwelt 2024