
- Start >
- Rivers >
- Discharge >
- Oberer Main - Elbe >
- Unterleinleiter >
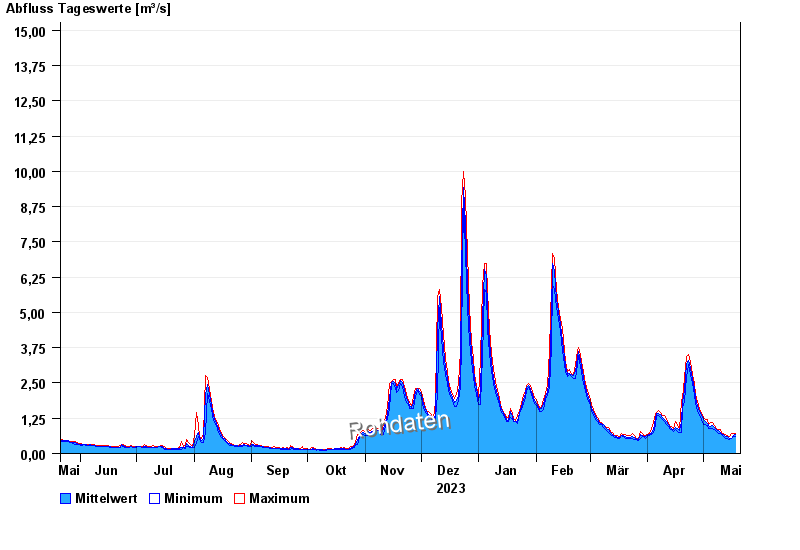
- Chart of year

Chart of year Unterleinleiter / Leinleiterbach
Discharge from 21.05.2023 to 20.05.2024
- 23.02.1970 Abfluss: 31 m³/s
- 26.01.1995 Abfluss: 30,7 m³/s
- 06.01.1982 Abfluss: 23,5 m³/s
- 26.03.1988 Abfluss: 21 m³/s
- 14.01.2011 Abfluss: 19,1 m³/s
| Date | Mean value [m³/s] | Maximum [m³/s] | Minimum [m³/s] |
|---|---|---|---|
| 20.05.2024 | 0.606 | 0.665 | 0.549 |
| 19.05.2024 | 0.632 | 0.665 | 0.625 |
| 18.05.2024 | 0.658 | 0.706 | 0.586 |
| 17.05.2024 | 0.636 | 0.706 | 0.586 |
| 16.05.2024 | 0.548 | 0.706 | 0.515 |
| 15.05.2024 | 0.541 | 0.586 | 0.481 |
| 14.05.2024 | 0.589 | 0.625 | 0.515 |
© Bayerisches Landesamt für Umwelt 2024