
- Start >
- Rivers >
- Discharge >
- Oberer Main - Elbe >
- Unterleinleiter >
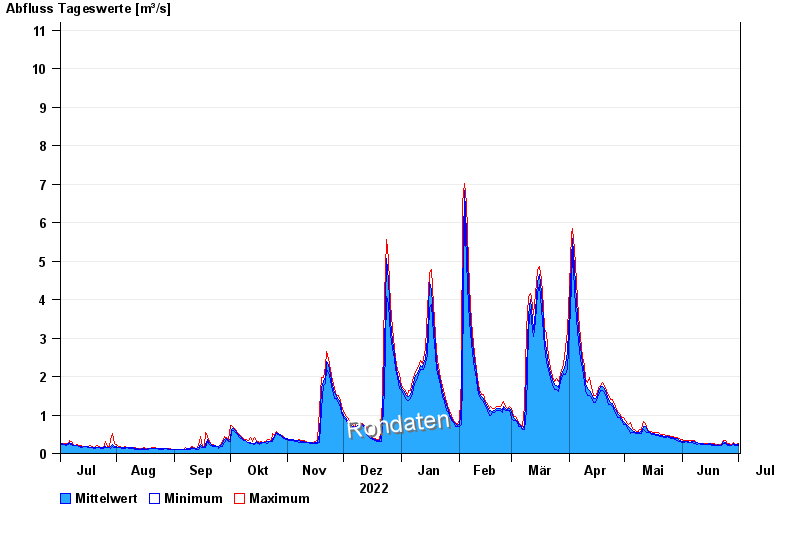
- Chart of year

Chart of year Unterleinleiter / Leinleiterbach
Discharge from 02.07.2022 to 01.07.2023
- 23.02.1970 Abfluss: 31 m³/s
- 26.01.1995 Abfluss: 30,7 m³/s
- 06.01.1982 Abfluss: 23,5 m³/s
- 26.03.1988 Abfluss: 21 m³/s
- 14.01.2011 Abfluss: 19,1 m³/s
| Date | Mean value [m³/s] | Maximum [m³/s] | Minimum [m³/s] |
|---|---|---|---|
| 01.07.2023 | 0.231 | 0.248 | 0.215 |
| 30.06.2023 | 0.222 | 0.231 | 0.215 |
| 29.06.2023 | 0.229 | 0.248 | 0.215 |
| 28.06.2023 | 0.25 | 0.286 | 0.231 |
| 27.06.2023 | 0.22 | 0.231 | 0.215 |
| 26.06.2023 | 0.227 | 0.248 | 0.215 |
| 25.06.2023 | 0.239 | 0.266 | 0.215 |
© Bayerisches Landesamt für Umwelt 2024