
- Start >
- Rivers >
- Discharge >
- Oberer Main - Elbe >
- Unterlangenstadt >
- Chart of year

Chart of year Unterlangenstadt / Rodach
Discharge from 01.01.2023 to 31.12.2023
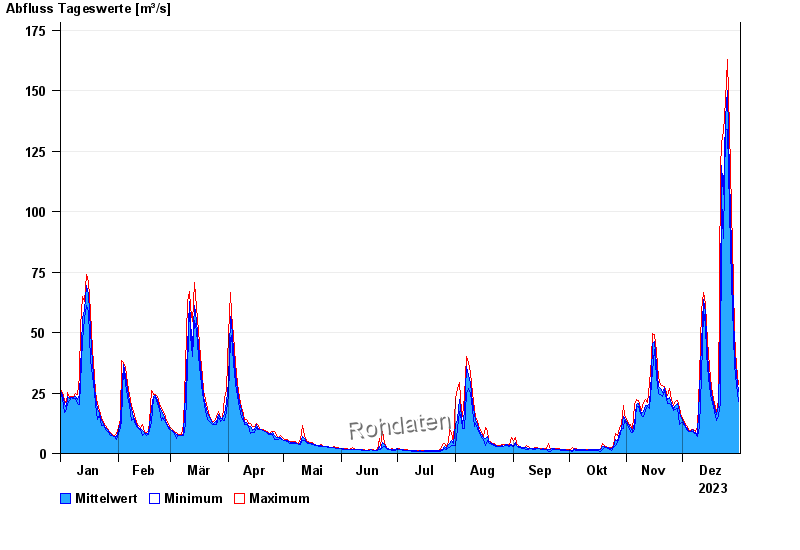
| Date | Mean value [m³/s] | Maximum [m³/s] | Minimum [m³/s] |
|---|---|---|---|
| 31.12.2023 | 25.7 | 28.6 | 21.4 |
| 30.12.2023 | 32.3 | 36.4 | 28.6 |
| 29.12.2023 | 42 | 49.1 | 36.4 |
| 28.12.2023 | 59.1 | 70.8 | 49.1 |
| 27.12.2023 | 84.9 | 101 | 70.8 |
| 26.12.2023 | 115 | 134 | 101 |
| 25.12.2023 | 150 | 163 | 134 |
© Bayerisches Landesamt für Umwelt 2024