
- Start >
- Rivers >
- Discharge >
- Oberer Main - Elbe >
- Unterlangenstadt >
- Chart of total period

Chart of total period Unterlangenstadt / Rodach
Discharge from 01.11.1930 to 26.04.2024
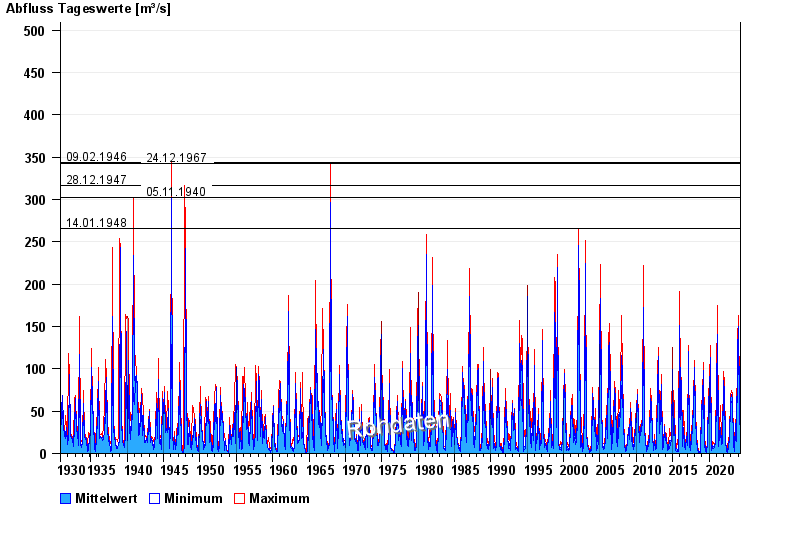
- 09.02.1946 Abfluss: 344 m³/s
- 24.12.1967 Abfluss: 342 m³/s
- 28.12.1947 Abfluss: 316 m³/s
- 05.11.1940 Abfluss: 302 m³/s
- 14.01.1948 Abfluss: 266 m³/s
| Date | Mean value [m³/s] | Maximum [m³/s] | Minimum [m³/s] |
|---|---|---|---|
| 26.04.2024 | 15.2 | 16 | 14.6 |
| 25.04.2024 | 15.5 | 16.8 | 14.6 |
| 24.04.2024 | 14.9 | 15.3 | 14.6 |
| 23.04.2024 | 15.6 | 16.4 | 15.3 |
| 22.04.2024 | 16 | 19.2 | 15.3 |
| 21.04.2024 | 16.5 | 17.2 | 14.9 |
| 20.04.2024 | 14.8 | 16 | 13.5 |
© Bayerisches Landesamt für Umwelt 2024