
- Start >
- Rivers >
- Discharge >
- Oberer Main - Elbe >
- Unterlangenstadt >
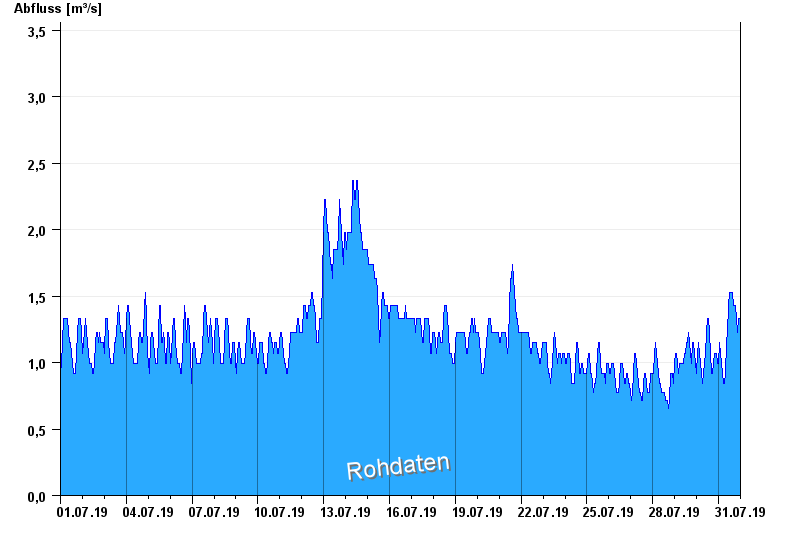
- Chart of month

Chart of month Unterlangenstadt / Rodach
Discharge from 01.07.2019 to 31.07.2019
- 09.02.1946 Abfluss: 344 m³/s
- 24.12.1967 Abfluss: 342 m³/s
- 28.12.1947 Abfluss: 316 m³/s
- 05.11.1940 Abfluss: 302 m³/s
- 14.01.1948 Abfluss: 266 m³/s
| Date | Runoff [m³/s] |
|---|---|
| 01.08.2019 00:45 | 1.33 |
| 01.08.2019 00:30 | 1.33 |
| 01.08.2019 00:15 | 1.33 |
| 01.08.2019 00:00 | 1.33 |
| 31.07.2019 23:45 | 1.33 |
| 31.07.2019 23:30 | 1.33 |
| 31.07.2019 23:15 | 1.33 |
© Bayerisches Landesamt für Umwelt 2024