
- Start >
- Rivers >
- Discharge >
- Oberer Main - Elbe >
- Unterlangenstadt >
- Chart of month

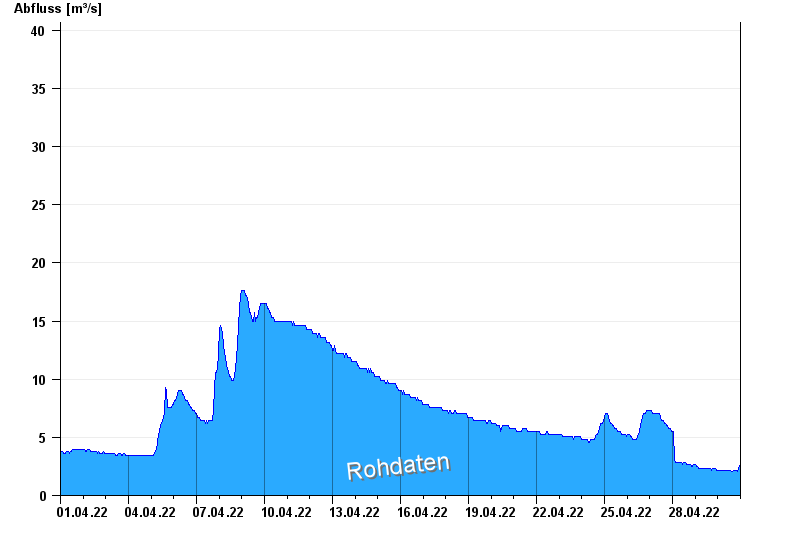
Chart of month Unterlangenstadt / Rodach
Discharge from 01.04.2022 to 30.04.2022
- HQ1 110 m³/s
- HQ2 135 m³/s
- HQ5 175 m³/s
- HQ10 225 m³/s
- HQ20 275 m³/s
- HQ50 345 m³/s
- HQ100 400 m³/s
| Date | Runoff [m³/s] |
|---|---|
| 01.05.2022 00:45 | 2.66 |
| 01.05.2022 00:30 | 2.66 |
| 01.05.2022 00:15 | 2.66 |
| 01.05.2022 00:00 | 2.66 |
| 30.04.2022 23:45 | 2.66 |
| 30.04.2022 23:30 | 2.66 |
| 30.04.2022 23:15 | 2.5 |
© Bayerisches Landesamt für Umwelt 2024