
- Start >
- Rivers >
- Discharge >
- Oberer Main - Elbe >
- Unterjettenberg >
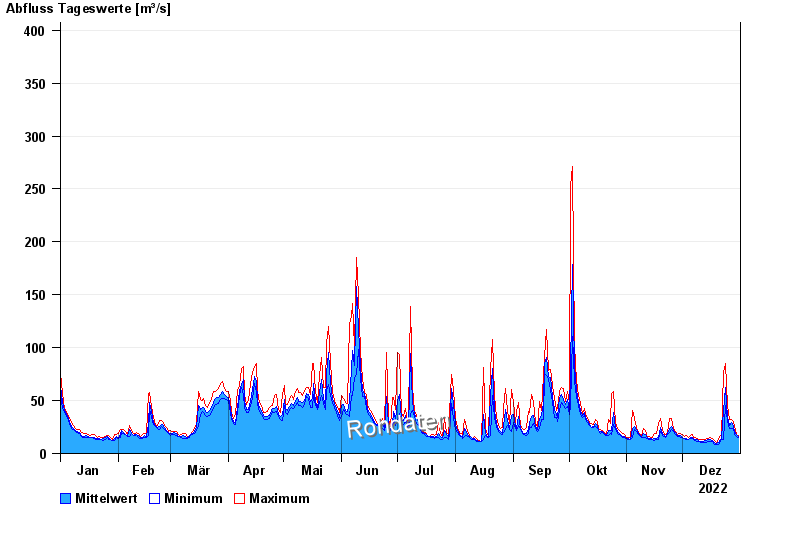
- Chart of year

Chart of year Unterjettenberg / Saalach
Discharge from 01.01.2022 to 31.12.2022
- 02.06.2013 Abfluss: 807 m³/s
- 12.08.2002 Abfluss: 705 m³/s
- 26.06.1995 Abfluss: 582 m³/s
- 03.06.2010 Abfluss: 567 m³/s
- 01.08.1977 Abfluss: 562 m³/s
| Date | Mean value [m³/s] | Maximum [m³/s] | Minimum [m³/s] |
|---|---|---|---|
| 31.12.2022 | 16 | 16.8 | 15.4 |
| 30.12.2022 | 17.5 | 18.4 | 16.1 |
| 29.12.2022 | 20.7 | 25.1 | 18.4 |
| 28.12.2022 | 25.4 | 30.1 | 23.4 |
| 27.12.2022 | 29.1 | 32.3 | 23.4 |
| 26.12.2022 | 26.2 | 32.3 | 23.4 |
| 25.12.2022 | 34 | 45.1 | 30.1 |
© Bayerisches Landesamt für Umwelt 2024