
- Start >
- Rivers >
- Discharge >
- Oberer Main - Elbe >
- Unterhammer >
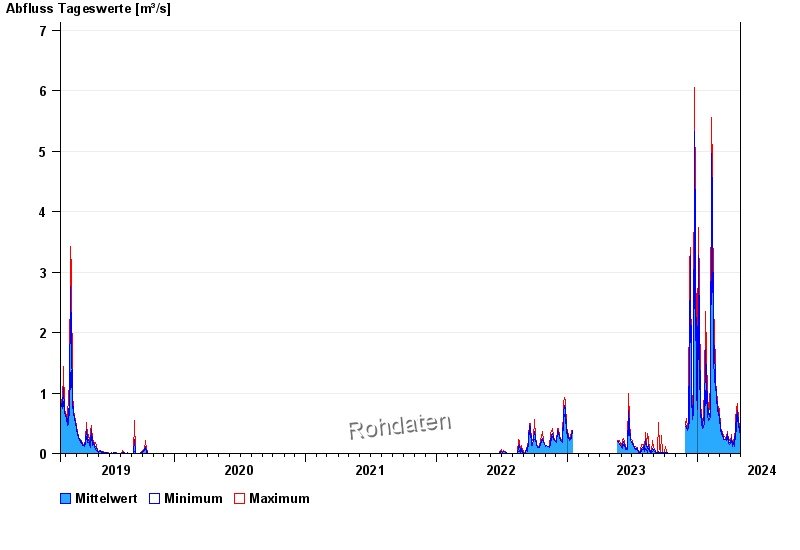
- Chart of total period

Chart of total period Unterhammer / Südliche Regnitz
Discharge from 15.02.2019 to 29.04.2024
note
Kein Netz
| Date | Mean value [m³/s] | Maximum [m³/s] | Minimum [m³/s] |
|---|---|---|---|
| 29.04.2024 | 0.301 | 0.301 | 0.301 |
| 28.04.2024 | 0.333 | 0.342 | 0.301 |
| 27.04.2024 | 0.368 | 0.384 | 0.262 |
| 26.04.2024 | 0.421 | 0.45 | 0.384 |
| 25.04.2024 | 0.434 | 0.473 | 0.406 |
| 24.04.2024 | 0.435 | 0.45 | 0.406 |
| 23.04.2024 | 0.495 | 0.54 | 0.45 |
© Bayerisches Landesamt für Umwelt 2024