
- Start >
- Rivers >
- Discharge >
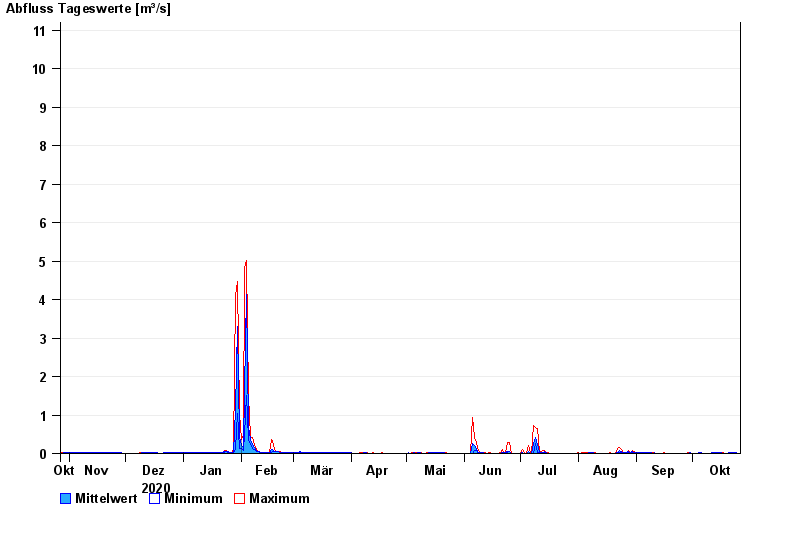
- Oberer Main - Elbe >
- Unterbruck Flutmulde >
- Chart of year

Chart of year Unterbruck Flutmulde / Haidenaab
Discharge from 27.10.2020 to 26.10.2021
 Für diesen Pegel sind keine Jährlichkeiten hinterlegt.
| Date | Mean value [m³/s] | Maximum [m³/s] | Minimum [m³/s] |
|---|---|---|---|
| 26.10.2021 | 0.012 | 0.012 | 0.012 |
| 25.10.2021 | 0.013 | 0.013 | 0.012 |
| 24.10.2021 | 0.013 | 0.013 | 0.013 |
| 23.10.2021 | 0.014 | 0.014 | 0.013 |
| 22.10.2021 | 0.014 | 0.015 | 0.014 |
| 21.10.2021 | 0.021 | 0.031 | 0.012 |
| 20.10.2021 | 0.012 | 0.012 | 0.012 |
© Bayerisches Landesamt für Umwelt 2024