
- Start >
- Rivers >
- Discharge >
- Oberer Main - Elbe >
- Unterbruck Flutmulde >
- Chart of year

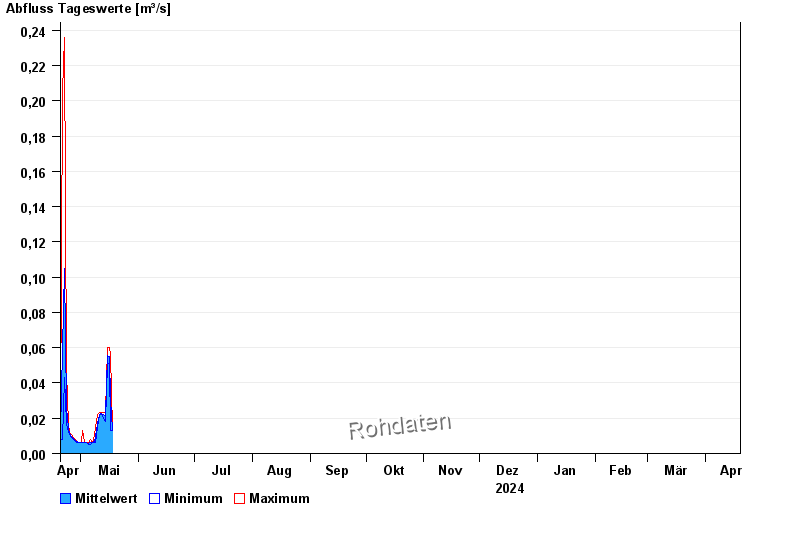
Chart of year Unterbruck Flutmulde / Haidenaab
Discharge from 20.04.2024 to 19.04.2025
 Für diesen Pegel sind keine Jährlichkeiten hinterlegt.
| Date | Mean value [m³/s] | Maximum [m³/s] | Minimum [m³/s] |
|---|---|---|---|
| 18.05.2024 | 0.013 | 0.013 | 0.013 |
| 17.05.2024 | 0.031 | 0.056 | 0.013 |
| 16.05.2024 | 0.055 | 0.06 | 0.051 |
| 15.05.2024 | 0.056 | 0.06 | 0.051 |
| 14.05.2024 | 0.022 | 0.023 | 0.018 |
| 13.05.2024 | 0.022 | 0.023 | 0.02 |
| 12.05.2024 | 0.023 | 0.023 | 0.022 |
© Bayerisches Landesamt für Umwelt 2024