
- Start >
- Rivers >
- Discharge >
- Oberer Main - Elbe >
- Unterbruck >
- Chart of year

Chart of year Unterbruck / Haidenaab
Discharge from 26.09.2020 to 25.09.2021
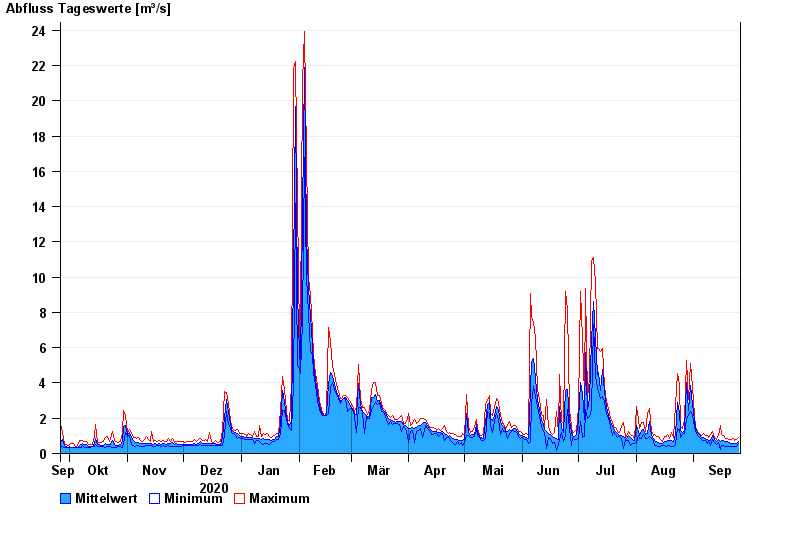
| Date | Mean value [m³/s] | Maximum [m³/s] | Minimum [m³/s] |
|---|---|---|---|
| 25.09.2021 | 0.682 | 0.917 | 0.552 |
| 24.09.2021 | 0.565 | 0.782 | 0.383 |
| 23.09.2021 | 0.561 | 0.719 | 0.383 |
| 22.09.2021 | 0.591 | 0.849 | 0.383 |
| 21.09.2021 | 0.571 | 0.783 | 0.383 |
| 20.09.2021 | 0.63 | 0.783 | 0.421 |
| 19.09.2021 | 0.671 | 0.85 | 0.421 |
© Bayerisches Landesamt für Umwelt 2024