
- Start >
- Rivers >
- Discharge >
- Oberer Main - Elbe >
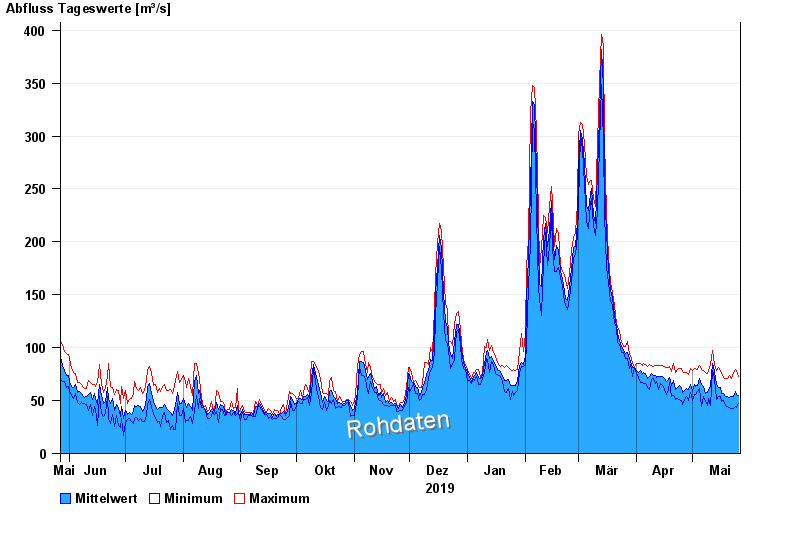
- Trunstadt >
- Chart of year

Chart of year Trunstadt / Main
Discharge from 27.05.2019 to 26.05.2020
| Date | Mean value [m³/s] | Maximum [m³/s] | Minimum [m³/s] |
|---|---|---|---|
| 26.05.2020 | 54.9 | 72.8 | 47.6 |
| 25.05.2020 | 56.1 | 78.9 | 43.9 |
| 24.05.2020 | 58.3 | 79.4 | 44.6 |
| 23.05.2020 | 53.7 | 76.9 | 42.9 |
| 22.05.2020 | 53.4 | 70.8 | 42.6 |
| 21.05.2020 | 53.1 | 73.3 | 43.4 |
| 20.05.2020 | 53.4 | 71.3 | 44.5 |
© Bayerisches Landesamt für Umwelt 2024