
- Start >
- Rivers >
- Discharge >
- Oberer Main - Elbe >
- Trunstadt >
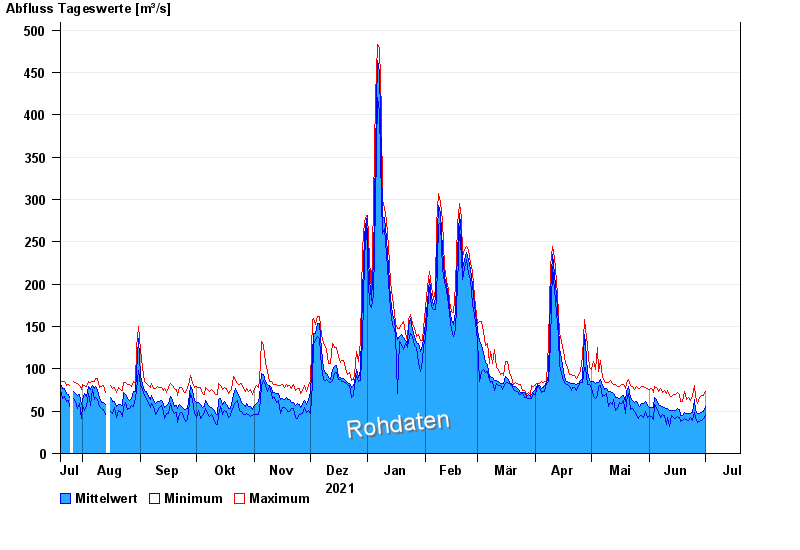
- Chart of year

Chart of year Trunstadt / Main
Discharge from 20.07.2021 to 19.07.2022
| Date | Mean value [m³/s] | Maximum [m³/s] | Minimum [m³/s] |
|---|---|---|---|
| 01.07.2022 | 55.3 | 73.2 | 44.4 |
| 30.06.2022 | 49.4 | 68.3 | 41.5 |
| 29.06.2022 | 48.1 | 68.3 | 39.4 |
| 28.06.2022 | 47.3 | 65.9 | 38.3 |
| 27.06.2022 | 47.1 | 59.4 | 36.3 |
| 26.06.2022 | 50.5 | 67.5 | 41.4 |
| 25.06.2022 | 63.8 | 80.7 | 48.1 |
© Bayerisches Landesamt für Umwelt 2024