
- Start >
- Rivers >
- Discharge >
- Oberer Main - Elbe >
- Trunstadt >
- Chart of year

Chart of year Trunstadt / Main
Discharge from 23.02.2021 to 22.02.2022
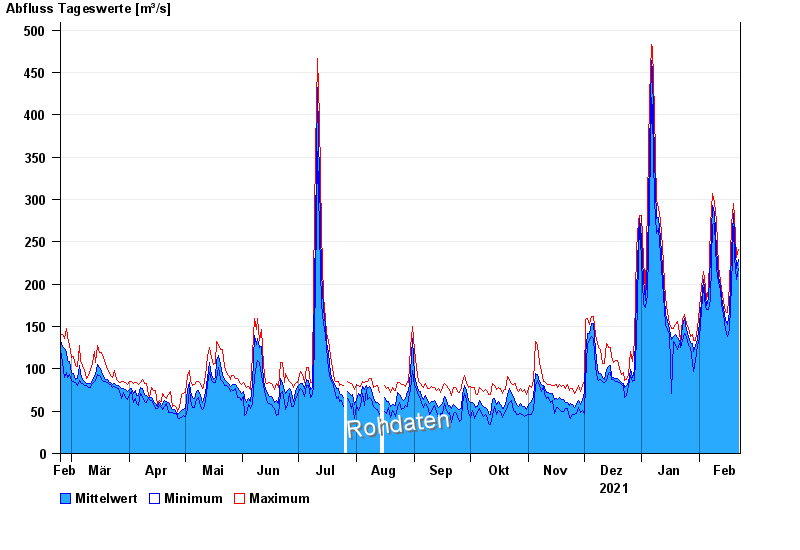
| Date | Mean value [m³/s] | Maximum [m³/s] | Minimum [m³/s] |
|---|---|---|---|
| 22.02.2022 | 229 | 241 | 219 |
| 21.02.2022 | 219 | 231 | 206 |
| 20.02.2022 | 257 | 279 | 231 |
| 19.02.2022 | 283 | 295 | 268 |
| 18.02.2022 | 239 | 270 | 198 |
| 17.02.2022 | 168 | 198 | 146 |
| 16.02.2022 | 152 | 166 | 138 |
© Bayerisches Landesamt für Umwelt 2024