
- Start >
- Rivers >
- Discharge >
- Oberer Main - Elbe >
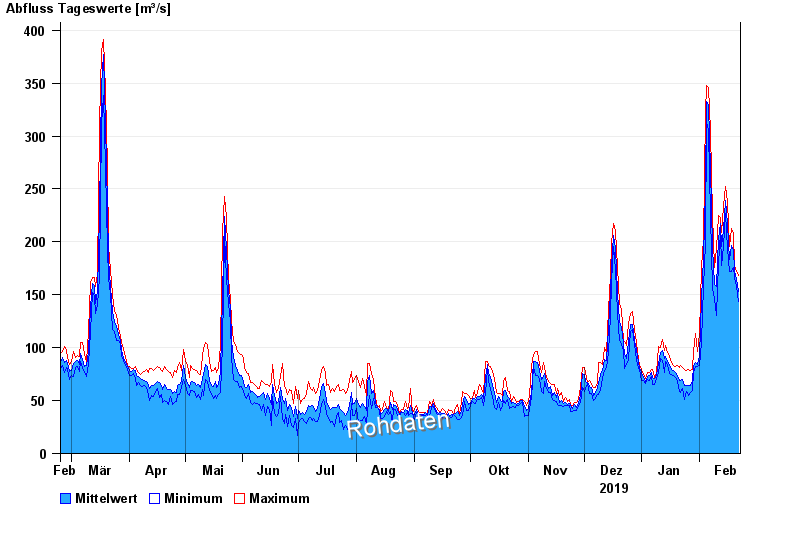
- Trunstadt >
- Chart of year

Chart of year Trunstadt / Main
Discharge from 23.02.2019 to 22.02.2020
| Date | Mean value [m³/s] | Maximum [m³/s] | Minimum [m³/s] |
|---|---|---|---|
| 22.02.2020 | 153 | 168 | 144 |
| 21.02.2020 | 164 | 172 | 158 |
| 20.02.2020 | 173 | 178 | 166 |
| 19.02.2020 | 192 | 208 | 176 |
| 18.02.2020 | 197 | 213 | 172 |
| 17.02.2020 | 183 | 196 | 172 |
| 16.02.2020 | 216 | 237 | 194 |
© Bayerisches Landesamt für Umwelt 2024