
- Start >
- Rivers >
- Discharge >
- Oberer Main - Elbe >
- Trunstadt >
- Chart of year

Chart of year Trunstadt / Main
Discharge from 01.01.2019 to 31.12.2019
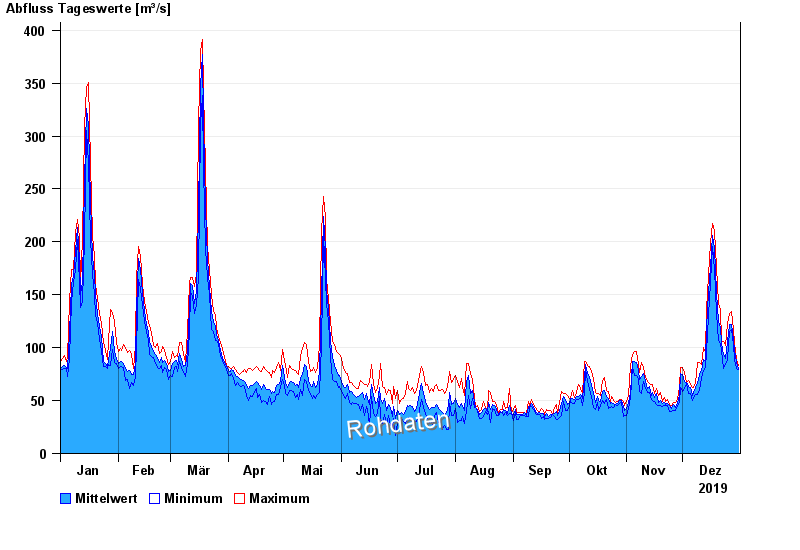
| Date | Mean value [m³/s] | Maximum [m³/s] | Minimum [m³/s] |
|---|---|---|---|
| 31.12.2019 | 80.4 | 83.6 | 79.5 |
| 30.12.2019 | 85.9 | 88.9 | 80.3 |
| 29.12.2019 | 98.5 | 105 | 88.8 |
| 28.12.2019 | 107 | 117 | 103 |
| 27.12.2019 | 122 | 134 | 117 |
| 26.12.2019 | 122 | 132 | 115 |
| 25.12.2019 | 106 | 123 | 88.9 |
© Bayerisches Landesamt für Umwelt 2024