
- Start >
- Rivers >
- Discharge >
- Oberer Main - Elbe >
- Trunstadt >
- Chart of year

Chart of year Trunstadt / Main
Discharge from 01.01.2024 to 24.04.2024
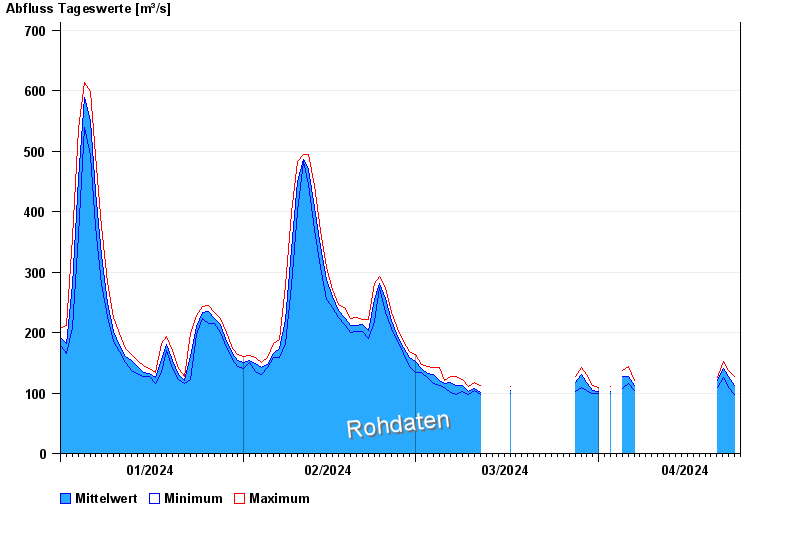
| Date | Mean value [m³/s] | Maximum [m³/s] | Minimum [m³/s] |
|---|---|---|---|
| 24.04.2024 | 112 | 128 | 97 |
| 23.04.2024 | 127 | 138 | 109 |
| 22.04.2024 | 140 | 152 | 125 |
| 21.04.2024 | 120 | 125 | 109 |
| 20.04.2024 | -- | -- | -- |
| 19.04.2024 | -- | -- | -- |
| 18.04.2024 | -- | -- | -- |
© Bayerisches Landesamt für Umwelt 2024