
- Start >
- Rivers >
- Discharge >
- Oberer Main - Elbe >
- Trebgast >
- Chart of year

Chart of year Trebgast / Trebgast
Discharge from 01.01.2020 to 31.12.2020
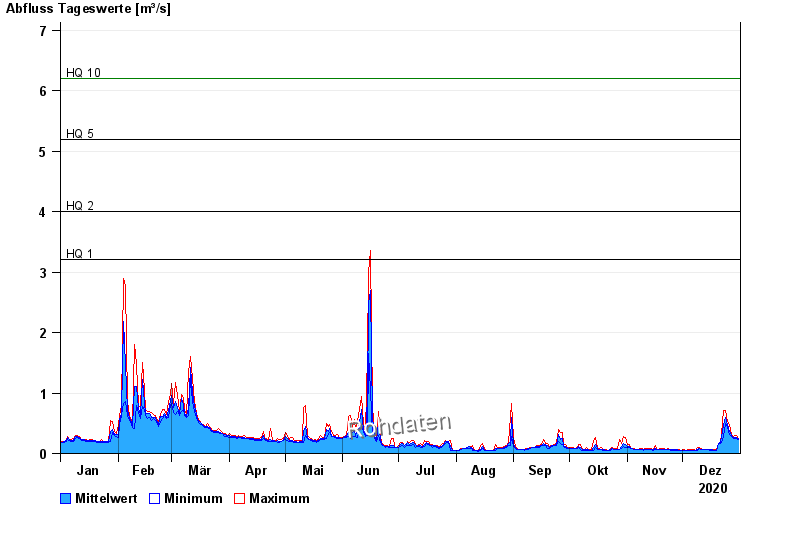
- HQ1 3,2 m³/s
- HQ2 4 m³/s
- HQ5 5,2 m³/s
- HQ10 6,2 m³/s
- HQ20 7,1 m³/s
- HQ50 8,4 m³/s
- HQ100 10 m³/s
| Date | Mean value [m³/s] | Maximum [m³/s] | Minimum [m³/s] |
|---|---|---|---|
| 31.12.2020 | 0.24 | 0.247 | 0.231 |
| 30.12.2020 | 0.259 | 0.296 | 0.247 |
| 29.12.2020 | 0.27 | 0.296 | 0.247 |
| 28.12.2020 | 0.258 | 0.279 | 0.247 |
| 27.12.2020 | 0.292 | 0.318 | 0.279 |
| 26.12.2020 | 0.367 | 0.478 | 0.318 |
| 25.12.2020 | 0.482 | 0.528 | 0.429 |
© Bayerisches Landesamt für Umwelt 2024