
- Start >
- Rivers >
- Discharge >
- Oberer Main - Elbe >
- Trebgast >
- Chart of year

Chart of year Trebgast / Trebgast
Discharge from 01.01.2019 to 31.12.2019
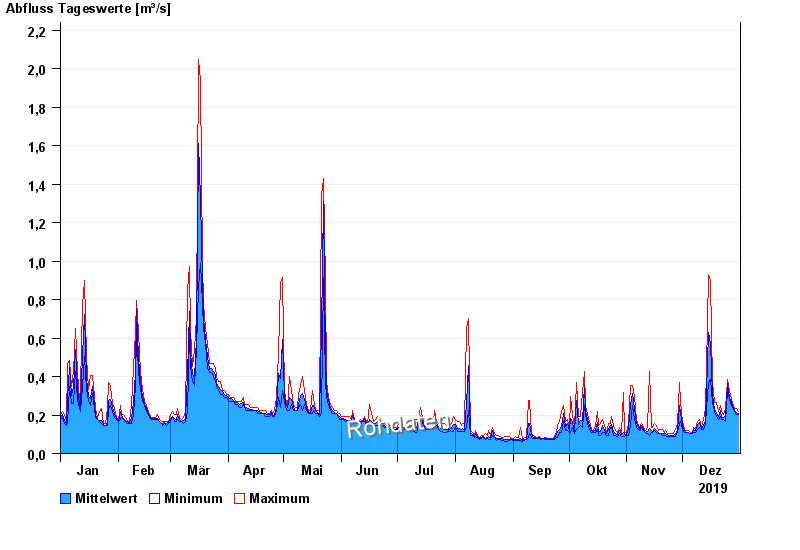
| Date | Mean value [m³/s] | Maximum [m³/s] | Minimum [m³/s] |
|---|---|---|---|
| 31.12.2019 | 0.21 | 0.219 | 0.204 |
| 30.12.2019 | 0.215 | 0.234 | 0.204 |
| 29.12.2019 | 0.221 | 0.234 | 0.219 |
| 28.12.2019 | 0.237 | 0.249 | 0.234 |
| 27.12.2019 | 0.264 | 0.28 | 0.249 |
| 26.12.2019 | 0.292 | 0.323 | 0.28 |
| 25.12.2019 | 0.362 | 0.386 | 0.323 |
© Bayerisches Landesamt für Umwelt 2024