
- Start >
- Rivers >
- Discharge >
- Oberer Main - Elbe >
- Steinberg >
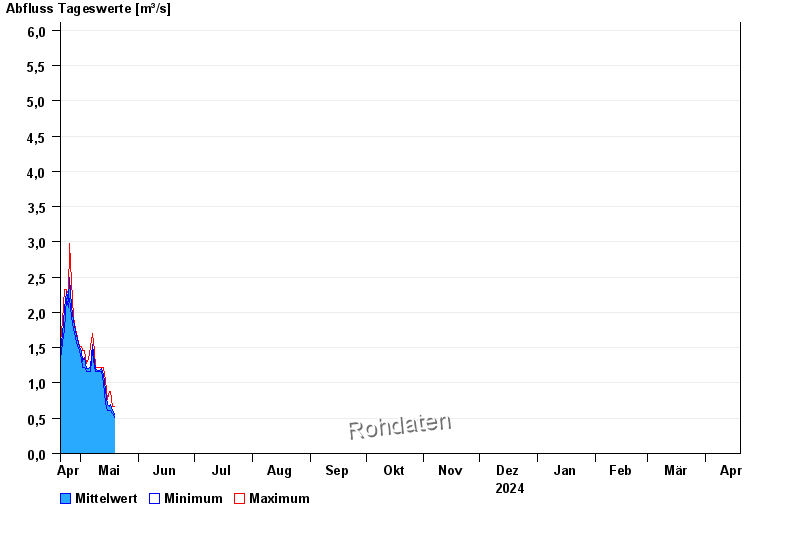
- Chart of year

Chart of year Steinberg / Kronach
Discharge from 20.04.2024 to 19.04.2025
- HQ1 20 m³/s
- HQ2 25,5 m³/s
- HQ5 35 m³/s
- HQ10 43 m³/s
- HQ20 53 m³/s
- HQ50 68 m³/s
- HQ100 80 m³/s
| Date | Mean value [m³/s] | Maximum [m³/s] | Minimum [m³/s] |
|---|---|---|---|
| 02.05.2024 | 1.32 | 1.33 | 1.22 |
| 01.05.2024 | 1.44 | 1.52 | 1.33 |
| 30.04.2024 | 1.51 | 1.52 | 1.46 |
| 29.04.2024 | 1.61 | 1.64 | 1.52 |
| 28.04.2024 | 1.74 | 1.76 | 1.64 |
| 27.04.2024 | 1.88 | 1.94 | 1.76 |
| 26.04.2024 | 2.09 | 2.44 | 1.94 |
© Bayerisches Landesamt für Umwelt 2024