
- Start >
- Rivers >
- Discharge >
- Oberer Main - Elbe >
- Steinberg >
- Chart of year

Chart of year Steinberg / Kronach
Discharge from 01.01.2023 to 31.12.2023
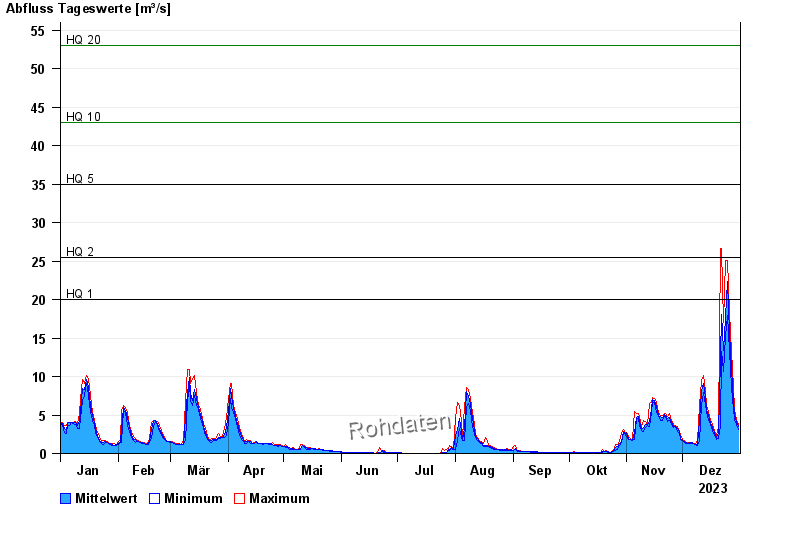
- HQ1 20 m³/s
- HQ2 25,5 m³/s
- HQ5 35 m³/s
- HQ10 43 m³/s
- HQ20 53 m³/s
- HQ50 68 m³/s
- HQ100 80 m³/s
| Date | Mean value [m³/s] | Maximum [m³/s] | Minimum [m³/s] |
|---|---|---|---|
| 31.12.2023 | 3.46 | 3.78 | 3.12 |
| 30.12.2023 | 4.06 | 4.47 | 3.78 |
| 29.12.2023 | 5.18 | 5.71 | 4.47 |
| 28.12.2023 | 6.81 | 8.6 | 5.71 |
| 27.12.2023 | 11.1 | 13.3 | 8.6 |
| 26.12.2023 | 15.6 | 18.3 | 13.3 |
| 25.12.2023 | 22.4 | 25.1 | 17.9 |
© Bayerisches Landesamt für Umwelt 2025