
- Start >
- Rivers >
- Discharge >
- Oberer Main - Elbe >
- Staudach >
- Chart of year

Chart of year Staudach / Tiroler Achen
Discharge from 01.01.2024 to 29.04.2024
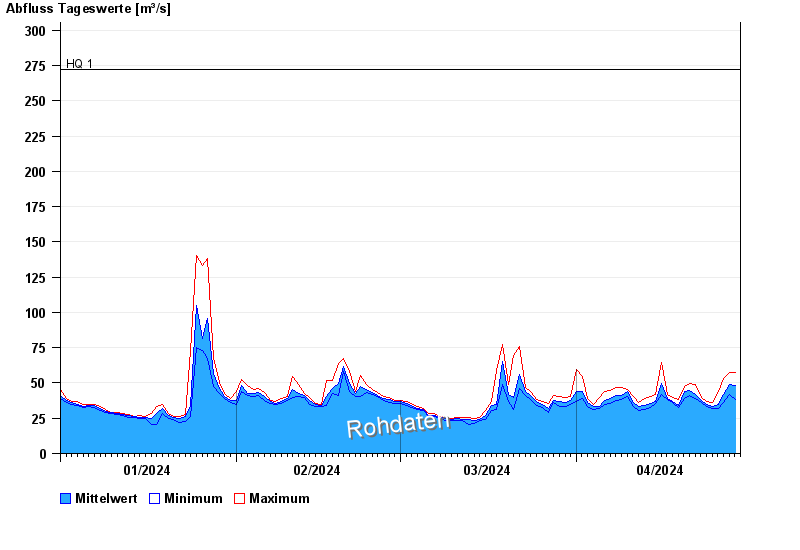
- HQ1 272 m³/s
- HQ2 350 m³/s
- HQ5 440 m³/s
- HQ10 530 m³/s
- HQ20 630 m³/s
- HQ50 760 m³/s
- HQ100 870 m³/s
| Date | Mean value [m³/s] | Maximum [m³/s] | Minimum [m³/s] |
|---|---|---|---|
| 29.04.2024 | 48.1 | 57.3 | 38.1 |
| 28.04.2024 | 48.7 | 57.3 | 42.1 |
| 27.04.2024 | 41.5 | 53 | 35.9 |
| 26.04.2024 | 34.9 | 43.7 | 32.2 |
| 25.04.2024 | 33.5 | 35.9 | 32.2 |
| 24.04.2024 | 34.9 | 36.6 | 33.6 |
| 23.04.2024 | 37.4 | 39.7 | 35.9 |
© Bayerisches Landesamt für Umwelt 2024