
- Start >
- Rivers >
- Discharge >
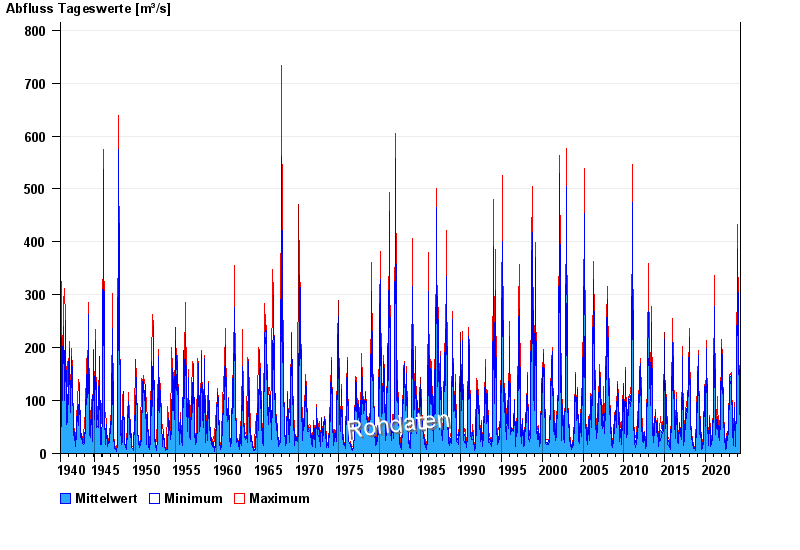
- Oberer Main - Elbe >
- Schwürbitz >
- Chart of total period

Chart of total period Schwürbitz / Main
Discharge from 01.11.1940 to 26.04.2024
| Date | Mean value [m³/s] | Maximum [m³/s] | Minimum [m³/s] |
|---|---|---|---|
| 26.04.2024 | 42.4 | 42.8 | 41.6 |
| 25.04.2024 | 41 | 42.2 | 39.9 |
| 24.04.2024 | 42.9 | 46.6 | 41.1 |
| 23.04.2024 | 50 | 56.7 | 46.6 |
| 22.04.2024 | 60.2 | 61.6 | 56.7 |
| 21.04.2024 | 54.5 | 58.8 | 49.8 |
| 20.04.2024 | 45.1 | 49.8 | 37.6 |
© Bayerisches Landesamt für Umwelt 2024